
In this guide
A home battery payback period is the time it takes for the money saved on electricity to equal what the system cost to buy and install. It is not a property of the battery. It is a property of the battery plus the tariff, the household's consumption pattern, and whether solar is present. Independent guidance puts domestic battery storage payback in the region of 8 to 12 years, which is similar to the reported lifespan of the equipment1. A worked time-of-use example using a £4,600 battery gives a payback period of 9 years1. One maker quotes 7 to 10 years for a 10 kWh battery paired with existing solar2.
Those figures sit inside a wider range. Independent guidance on solar photovoltaics gives a financial payback of between 10 and 15 years for a domestic PV system, and notes that even using an import price of 20p per kWh and an export price of 10p per kWh, the payback time may only increase to just over 15 years3. A Scottish retrofit study quotes payback periods of 6 to 10 years when a battery is used to optimise self-generation from PV4. The spread is not disagreement about arithmetic. It is disagreement about inputs.
What payback period means for a home battery
Payback is a comparison between a capital cost paid once and a stream of avoided cost received over years. The capital cost is the installed price of the battery, inverter and any associated wiring. The avoided cost is the difference between what the household would have paid for the same units of electricity and what it pays instead, once the battery has moved those units from an expensive period to a cheap one, or from the grid to self-generated solar.
Two conventions matter. Simple payback divides capital cost by annual saving and ignores everything else. It takes no account of the fact that a battery degrades, that tariffs change, or that money spent on a battery cannot be spent elsewhere. A worked example in independent guidance shows how unforgiving simple payback can be: one configuration produces a simple payback of 29 years1. That figure is not a prediction about batteries in general. It is what happens when the annual saving is small relative to the capital cost.
The second convention is the one used in building regulation. Approved Document L2B, which applies in Wales, tests the economic feasibility of energy efficiency measures by asking whether the measure achieves a payback of the initial cost within 15 years through energy savings, calculated using the National Calculation Methodology and taking account of VAT7. The same 15 year test appears in earlier Part L guidance for existing dwellings8. That is a regulatory threshold, not a consumer expectation, but it sets a useful outer bound: a measure that cannot repay itself within 15 years fails the test the regulations apply.
A separate consultation on able-to-pay energy efficiency found that any payback mechanism would need to cover the cost of the investment within ten years to be acceptable to homeowners9. The gap between the ten year acceptability threshold and the fifteen year regulatory threshold is where most domestic battery quotes sit.
Payback in practice: 3 to 15 years depending on the setup
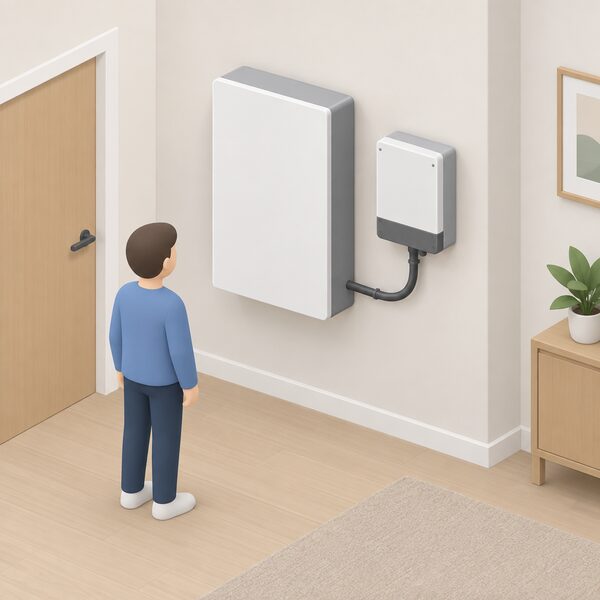
The published range runs from around 3 years at the optimistic end to 15 years or more at the pessimistic end, and the difference is almost entirely about how many units the battery moves each day and at what price difference.
At the fast end, a battery stacked with a steep time-of-use tariff and a large solar array can cycle close to fully every day. At the slow end, a battery in a low-consumption flat with no solar and a flat-rate tariff has almost nothing to arbitrage. Independent guidance on battery storage gives payback periods in the region of 8 to 12 years, which is similar to the reported lifespan1. Independent guidance on solar gives a financial payback of between 10 and 15 years for a PV system alone3. A Scottish study quotes 6 to 10 years for PV self-generation optimisation4.
The lifespan side of the ratio is more settled than the savings side. Domestic battery storage has a shorter lifetime of around 10 to 15 years when compared with solar panels10. Independent guidance puts the typical lifespan of a battery at about 10 to 12 years2. If payback is 12 years and lifespan is 10 years, the battery does not repay itself within its own service life. That is the arithmetic a household has to confront, and it is why the difference between an 8 year and a 12 year payback is not a rounding error.
There is also a configuration effect. One maker states that adding a whole-home backup gateway extends the payback period by 2 to 3 years6. Backup capability adds cost without adding savings, so it lengthens the period over which the household waits to break even. That is a trade-off between independence and return, not a fault in the arithmetic.
Battery-only or with solar: which pays back faster
The two cases earn money in different ways, and they are not interchangeable.
A battery with solar earns by storing surplus generation that would otherwise be exported, often at a low export rate, and using it later instead of importing at the full unit rate. The saving per unit is the import rate minus the export rate forgone. A battery without solar earns by charging on a cheap tariff period and discharging during an expensive one. The saving per unit is the peak rate minus the off-peak rate, minus round-trip losses.
Independent guidance describes the battery-only case as automatic in operation: charging stops when the battery is full, and the battery discharges when the next cheap tariff period ends2. That means the battery-only case is bounded by the length of the cheap window and the size of the battery. A battery that fills in three hours and then sits idle until the evening peak earns on only part of its capacity.
The solar case is bounded by how much surplus the array produces. Independent guidance notes that household solar generation takes longer to pay for its upfront costs5. Adding storage to an existing array changes the calculation because the capital cost of the panels is already sunk. One independent analysis found that adding a battery can significantly increase savings, with a £2,500 solar battery potentially increasing annual savings, producing a payback of about 10.5 years for the combined solar and battery system11.
"Adding a battery can significantly increase savings, with a £2,500 solar battery potentially increasing annual savings t"
The practical distinction is this: a battery with solar converts an existing low-value export into a high-value self-consumption. A battery without solar converts a cheap import into an avoided expensive import. Both are real, but the solar case usually has a larger price gap to work with, because export rates are typically well below import rates.
How the arithmetic is done: unit rates, cycles and daily savings
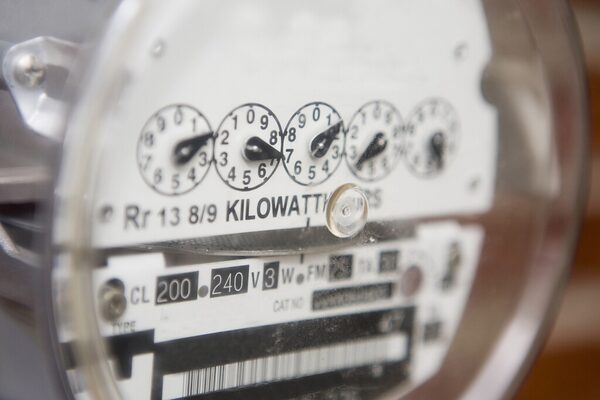
The core calculation is: daily saving equals the number of kilowatt hours shifted, multiplied by the price difference per kilowatt hour, minus losses. Annual saving is that figure multiplied by the number of days the battery operates at that level. Payback is capital cost divided by annual saving.
Every input is contestable. The number of kilowatt hours shifted depends on usable capacity, depth of discharge and how often the battery actually fills and empties. The price difference depends on the tariff. Losses depend on round-trip efficiency. The number of operating days depends on season and behaviour.
The published consumption benchmarks are the starting point for sizing the shifted volume. Ofgem's typical domestic consumption values give annual electricity consumption of 1,600 kWh for a low-use flat or one-bedroom home with one or two people, 2,500 kWh for a medium three-bedroom house with two or three people, and 3,800 kWh for a high-use five-bedroom house with four or five people12. The same source gives annual gas consumption of 6,000 kWh, 9,500 kWh and 14,000 kWh for the same three bands12. A separate source quotes Ofgem typical domestic consumption values of 11,500 kWh for an average home and 3,900 kWh for a flat, which is a different basis and shows how much the benchmark itself can vary13.
The unit rate side has moved sharply. The Ofgem price cap for 1 October 2026 sets electricity at 26.32p per kWh, a rise of 0.21p per kWh or 0.8% on the previous period, with a standing charge of 54.83p a day, down 2.36p5. Gas rose 8.7% over the same period to a standing charge of 29.68p a day5. For January to March 2026, the direct debit single rate was 27.83p per kWh for southern Scotland and 28.36p for northern Scotland, with gas at 5.89p per kWh across all of Scotland4. A South Wales (SWALEC) region rate of 26.33p per kWh with a 57.84p daily standing charge is quoted for 8 September 202614.
The regional variation is not trivial. Some regions, such as Merseyside and North Wales, pay substantially more than others, such as London5. A payback calculation using a national average will be wrong in both directions depending on where the household is.
What shortens payback: tariffs, sizing and usage patterns
Three levers move payback more than anything else: the tariff spread, the match between battery size and daily consumption, and the number of cycles the battery completes.
The tariff spread is the engine. Economy 7 charges two different prices for electricity depending on time of use15. The off-peak window is the period in which the battery charges. Sources disagree on its length: one gives seven hours during the night14, another gives the window between 22:00 and 08:3016. The disagreement matters because a longer cheap window allows a larger battery to fill completely, which increases the units shifted per day.
Sizing is the second lever. A battery that is too large for the household's daily consumption will not cycle fully, so the capital cost is spread over fewer useful kilowatt hours. A battery that is too small will fill and then stop, leaving cheap-rate energy unclaimed. The optimum is a battery that empties most of its usable capacity during the expensive period and refills during the cheap one.
Usage patterns are the third. A household that is out during the day and home in the evening has a different load profile from one that is home all day. The evening peak is when the battery discharges, so a household with a large evening load captures more of the spread.
The regulatory backdrop also shifts the numbers. The price cap applies to around 20 million GB households on variable tariffs, while around 11 million households are on fixed tariffs and so are unaffected by cap changes17. A household on a fixed tariff has locked in its import rate, which fixes one side of the arbitrage calculation for the duration of the fix. A household on a variable tariff sees the import rate move with the cap, which moves the saving.
VAT, grants and policy changes that alter the numbers
The capital cost side of the payback calculation is directly affected by tax treatment. Electrical batteries installed as part of the installation of a qualifying energy-saving material are reduced rated after 31 March 202718. The 0% VAT relief on home battery systems is currently set to run until 31 March 20276. A battery installed before that date carries a lower capital cost than one installed afterwards, and a lower capital cost shortens payback for the same annual saving.
The grant landscape is less directly relevant to batteries but shows how scheme deadlines work. The Electric Vehicle Chargepoint Grant for Renters and Flat Owners carries a four week notice period if the grant ends or the grant amount changes, with claims made before any public announcement honoured subject to the grant criteria19. The equivalent landlord scheme states that the government reserves the right to end or change the grant scheme and will aim to provide four weeks' notice of any end or change to the grant amount20. The Electric Vehicle Homecharge Scheme delivered over £69m in value to date, with the grant rate reduced over time from £950 in 201521. These are chargepoint grants, not battery grants, but the pattern of declining support over time is the same one that applies to the VAT relief.
The wider policy context affects the import rate side. The price cap rose 54% between winter 2021-22 and April 2022, peaked at £4,059 during 2023, and fell to £1,834 for October to December 2023 and £1,568 for July to September 202422. It was set at £1,755 per year for 1 October to 31 December 20255. From 1 April 2026, annual energy bills fell by £117, or 7%, for a typical household on electricity and gas paying by direct debit23. Average energy bills fell by 7%, or £9.75 a month, from 1 April under the Ofgem price cap24. From 1 July 2026, average household energy bills rose by £22125, a 13.5% increase on the previous quarter25.
The direction of travel in unit rates matters for payback. Electricity unit rates are being held roughly stable, helped by the Government cutting VAT on electricity26. Gas unit rates rose from 6.29p per kWh last winter to 8p from 1 October, up around 27% year on year and the highest for some time26. Initial predictions for the following period suggest a further 12% rise in the gas unit rate26. A household using a battery to shift electricity is insulated from the electricity side but not from the gas side, unless the battery is also running a heat pump.
Worked examples for typical UK homes
The following examples use published figures and show how the inputs combine. They are illustrations of the arithmetic, not predictions.
Example 1: medium house, battery only, time-of-use tariff. A three-bedroom house with two or three people uses 2,500 kWh of electricity a year12. A battery costing £4,600 is charged on a cheap overnight rate and discharged during the expensive period. Independent guidance gives this configuration a payback period of 9 years1. The saving comes entirely from the price difference between the two periods, multiplied by the units shifted each day.
Example 2: 10 kWh battery with existing solar. A household with an existing PV array adds a 10 kWh battery. One maker quotes a payback period of 7 to 10 years for this configuration6. The saving comes from storing surplus generation that would otherwise be exported at a low rate and using it later instead of importing at the full rate.
Example 3: solar and battery combined. An independent analysis found that adding a battery can significantly increase savings, with a £2,500 solar battery potentially increasing annual savings, producing a payback of about 10.5 years for the combined system11. The combined system has a higher capital cost than either component alone but captures both the self-consumption benefit and the arbitrage benefit.
Example 4: PV system alone. Independent guidance gives a financial payback of between 10 and 15 years for a domestic PV system, and notes that even using an import price of 20p per kWh and an export price of 10p per kWh, the payback time may only increase to just over 15 years3. Adding a battery to this system changes the calculation by converting low-value export into high-value self-consumption.
Example 5: battery with backup gateway. One maker states that adding a whole-home backup gateway extends the payback period by 2 to 3 years6. The backup function adds capital cost without adding savings, so the period lengthens.
| Configuration | Payback | Source basis |
|---|---|---|
| Battery only, time-of-use tariff, £4,600 battery | 9 years | Independent guidance1 |
| 10 kWh battery with existing solar | 7 to 10 years | Maker guidance6 |
| Solar and battery combined, £2,500 battery | about 10.5 years | Independent guidance11 |
| Domestic battery storage, general range | 8 to 12 years | Independent guidance1 |
| PV self-generation optimisation | 6 to 10 years | Independent guidance4 |
| Domestic PV system alone | 10 to 15 years | Independent guidance3 |
The table shows the range that published figures occupy. The differences come from the tariff, the presence of solar, the capital cost and the number of units shifted. A household comparing quotes should ask what tariff, what consumption profile and what battery size each figure assumes.
What the numbers mean for energy independence
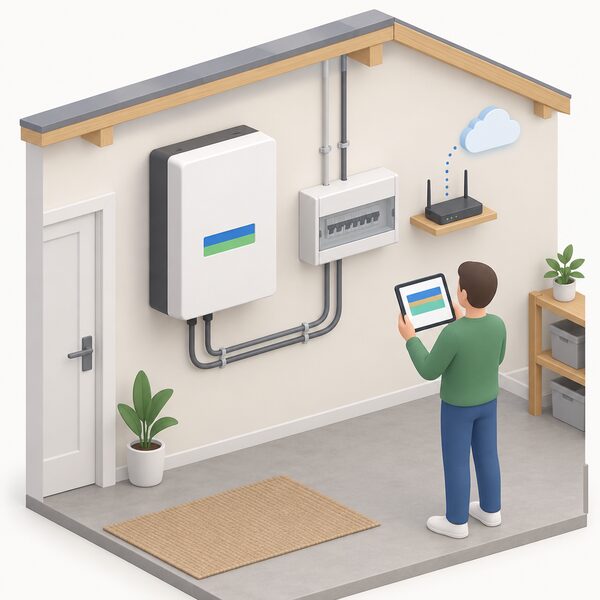
A battery changes the relationship between a household and its supplier, but it does not sever it. The household still imports electricity, still pays a standing charge, and still depends on the grid for the majority of its units unless it has substantial solar and a large battery. What the battery does is shift the timing of that dependence, moving consumption from expensive periods to cheap ones and from imported units to self-generated ones.
The dependence that remains is specific. The household depends on the tariff structure continuing to offer a price difference worth exploiting. It depends on the battery's manufacturer remaining in business to honour the warranty. It depends on the inverter and the monitoring app, which are typically cloud-connected and may require a working internet connection and a manufacturer's server. It depends on the grid for backup and for the periods when the battery is empty.
The savings are real but bounded. Independent guidance puts battery payback at 8 to 12 years against a lifespan of about 10 to 12 years1. That is a narrow margin. A household that wants a battery for independence, for backup, or for the ability to use its own solar at night may find the case stronger than the pure payback arithmetic suggests. A household that wants the fastest possible financial return should look at the tariff spread and the consumption profile before the battery specification.
The policy environment adds uncertainty. The 0% VAT relief ends on 31 March 20276. The price cap moves with wholesale gas prices, which are high due to the conflict in the Middle East16. The cap applies to around 20 million GB households on variable tariffs17. A battery installed today is making a bet on the shape of tariffs over the next decade, and that shape is not settled.
Sources26 cited
- Battery storage advice, Centre for Sustainable Energy, 2025
- Battery storage, Energy Saving Trust, 2026
- Solar photovoltaic, Centre for Alternative Technology, 2026
- Balancing investment in clean heat and energy efficiency in Scottish housing retrofit, ClimateXChange, 2026
- Ofgem price cap, End Fuel Poverty Coalition, 2026
- Best home battery storage UK, Jackery, 2026
- Building Regulations Part L and F review stage 2a, Welsh Government, 2020
- Building Regulations guidance Part L conservation of fuel and power, Welsh Government, 2023
- Summary of responses, Welsh Government, 2015
- POST note 771, Parliamentary Office of Science and Technology, 2026
- Battery storage and solar panels, The CPA, 2026
- Uswitch guide to kWh, Uswitch, 2026
- Electric heating, Centre for Sustainable Energy, 2026
- Economy 7 guide, Uswitch, 2026
- What is Economy 7, Confused.com, 2025
- When is the best time to switch my energy deal, Uswitch, 2026
- Ofgem confirms soaring gas prices will hit bills in winter 2026, End Fuel Poverty Coalition, 2026
- VAT energy saving materials, HM Revenue and Customs, 2027
- Electric Vehicle Chargepoint Grant for Renters and Flat Owners, UK Government, 2026
- Electric vehicle chargepoint grant for residential landlords, UK Government, 2026
- Electric vehicle charging market study final report, Competition and Markets Authority, 2021
- Energy bills support: an update, National Audit Office, 2024
- April 2026 price cap, National Energy Action, 2026
- Ministers signal no energy bill help until autumn, End Fuel Poverty Coalition, 2026
- Energy bills to rise by 13.5%, End Fuel Poverty Coalition, 2026
- UK gas prices hit 4 year high, End Fuel Poverty Coalition, 2026
 Payback Periods ComparedHow long does it take for a home energy upgrade to pay for itself?
 Cycle Life and DegradationHow long will a home battery actually last, and what decides that?
 Batteries and Smart TariffsA home battery can earn its keep if your electricity prices change through the day.
 Home Battery WarrantiesHow long does a home battery warranty really last, and what does it actually promise?
 What Size Battery?How much electricity does your home use in a day, and how much of that falls in the hours when power is cheap or your solar panels are generating?
 Savings and PaybackExplains how bill savings from solar are made up of avoided import and export income, and what drives the payback period.