
In this guide
Sizing a home battery is an arithmetic exercise before it is a shopping decision. The sum starts with how much electricity the home uses in a day, then asks how much of that use falls in the hours when a battery can charge cheaply or from solar, and how much of it the household wants to keep running when the grid is down. Ofgem's typical domestic consumption values give the benchmark: a medium electricity user consumes 2,500 kWh a year, a low user 1,600 kWh and a high user 3,800 kWh1. Those are annual figures, and the daily draw swings widely between a July week and a January one.
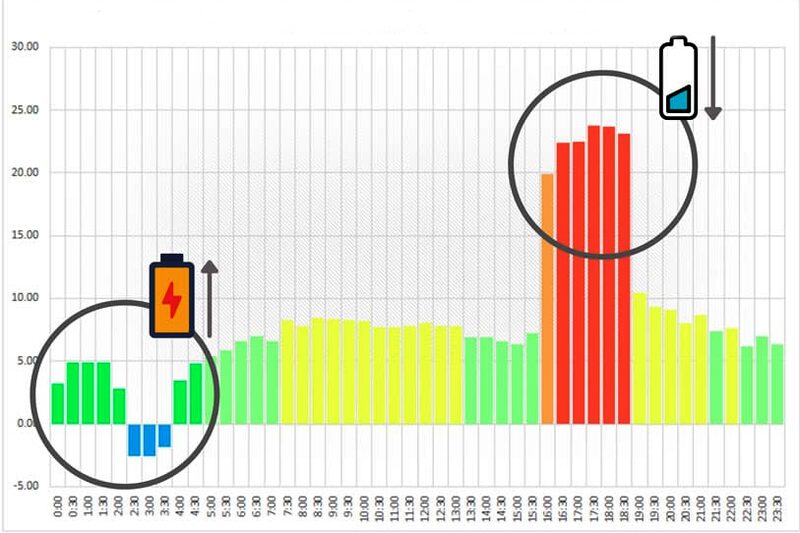
The second input is the shape of the day, not just its total. A battery is usually paired with solar panels, a smart time-of-use tariff, or both, so what matters is how much energy can be pulled into the battery during a cheap window or a sunny afternoon and pushed back out during the expensive hours3. A smart meter records consumption in half-hour periods, which is the resolution a sizing decision needs4.
The third input is what the household wants the battery to do when the grid fails, and the fourth is headroom: a battery is not a perfect bucket, and the figures used for sizing carry an allowance for losses and real-world variation. This page sets out the benchmark figures, how to read them from a smart meter, and where the sizing sum changes.
Sizing starts with how much electricity your home actually uses each day
The first number to establish is annual consumption in kWh, and the honest way to get it is from the meter rather than from a rule of thumb. Ofgem's medium electricity user at 2,500 kWh a year and the high user at 3,800 kWh a year are the benchmarks to compare against1. Those are averages across a year, and a household's actual daily draw in December can be several times its July figure once lighting and heating circulation run longer.
A battery does not need to cover the whole daily total to be useful. It needs to cover the portion of consumption that falls outside the hours when cheap or self-generated electricity is available. A household on a time-of-use tariff with a cheap overnight window might want enough capacity to shift most of its evening and morning peak use into that window; a household with solar might want enough to hold the afternoon's generation until the evening. Energy Saving Trust describes a typical home system as 10 kWh, which sits comfortably above the daily consumption of a medium user and below that of a high user3.
Sizing also has to account for the fact that a battery is not a perfect store. One maker's guidance offers a worked example in which a home with an annual consumption figure of 11 kWh would need 15 kWh of battery capacity to cover around 60 to 70% of its energy needs, an illustration of how far capacity can exceed a single day's consumption once losses and seasonal variation are allowed for7. The same maker's material puts the sizing headroom at around 15 to 20% for inverter losses, standby consumption and real-world variation, and separately at roughly 10 to 20% when sizing for essential loads only; the two figures are not reconciled, and a household comparing quotes may see either allowance used7.
The practical consequence is that a battery sized to a household's average day will fall short in winter and sit partly idle in summer. Sizing to the winter peak costs more and cycles less in the shoulder months. The evidence supports stating both figures and letting the household's own half-hourly data decide which side of that trade-off it sits on.
Ofgem's typical consumption values: the benchmark figures for low, medium and high use
Ofgem's typical domestic consumption values are the reference figures used across the industry for bills, price cap calculations and comparisons. They are not a prediction for any individual home, but they are the only published benchmark that a household can measure itself against.
| User profile | Electricity (kWh/year) | Gas (kWh/year) | Economy 7 electricity (kWh/year) |
|---|---|---|---|
| Low (flat or 1-bedroom house, 1 to 2 people) | 1,600 | 6,000 | 1,900 |
| Medium (3-bedroom house, 2 to 3 people) | 2,500 | 9,500 | 3,400 |
| High (5-bedroom house, 4 to 5 people) | 3,800 | 14,000 | 6,100 |
The electricity and Economy 7 columns come from the published typical user usage figures, and the gas column from the same source2. Ofgem's own price cap documentation uses a medium consumption figure of 2,700 kWh for electricity, 11,500 kWh for gas and 3,900 kWh for multi-register meters, which differs from the figures above and reflects the specific purpose of that calculation1. Independent reporting of the price cap has used 1,800 kWh electricity and 7,500 kWh gas for a low user, 2,700 kWh and 11,500 kWh for a medium user, and 4,100 kWh and 17,000 kWh for a high user8.
For battery sizing, the electricity column is the one that counts. A four-bedroom house with an electric vehicle or a heat pump will sit well above the high band, because the benchmark figures predate widespread electrification of transport and heating. The gas column matters indirectly: a household that later replaces a gas boiler with a heat pump moves a large share of its energy demand from gas to electricity, and a battery sized only against today's electricity figure will be undersized for that future.
The benchmark is a starting point for a conversation with an installer, not a sizing answer in itself. What turns it into a sizing answer is half-hourly data from the home's own meter.
A smart meter is what makes battery-sized decisions measurable
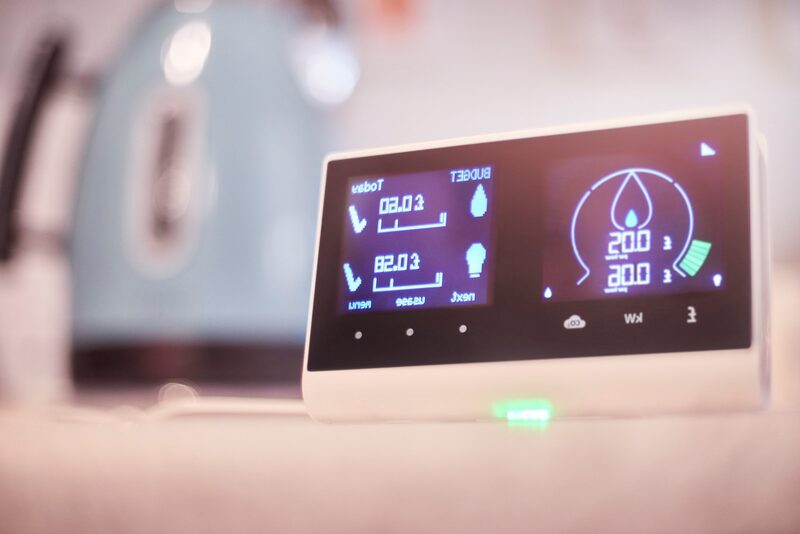
A smart meter automatically sends electricity and gas meter readings to the supplier, and bills are based on accurate readings rather than estimates9. More importantly for sizing, it records energy use in half-hour periods, which is the resolution at which a battery charges and discharges4. An annual figure tells a household how big its year was; half-hourly data tells it how much of that year fell inside the windows a battery can serve.
The in-home display is designed to give a close real-time estimate of energy usage and costs based on information received from the meter, which makes the daily pattern visible without any further equipment11. The meter itself, not the display, stores the official reading used for the account12. Smart meters can only measure the amount of energy used, and the data they provide puts a household in control of its energy usage, allowing energy-saving steps to be taken13.
Installation is free, arranged through the supplier, and typically takes about 90 minutes, or a couple of hours with a short loss of power while old meters are replaced6. Any household that pays for energy, whether owning or renting, should be able to book an installation where it is expected to work in the property17. A tenant paying the gas or electricity bills can choose to have a smart meter installed; where the landlord pays the bill, the decision is the landlord's18.
For battery sizing specifically, the value of the meter is that it turns a guess into a measurement. A household can read its own half-hourly consumption, identify the evening peak it wants to shift, and compare that against the capacity an installer proposes. Without that data, sizing rests on the benchmark bands and the installer's assumptions.
Why time-of-use tariffs and half-hourly data matter for a battery
Home battery storage is usually used in combination with solar panels or a smart time-of-use tariff, or both3. That pairing is what makes the battery earn its keep: the battery's job is to move consumption from an expensive half-hour to a cheap one, and both the import tariff and the export arrangement are settled on half-hourly readings.
The tariff side is where the smart meter becomes close to essential. A household does not need a smart meter simply to charge an electric vehicle, but without one it may not be able to access some EV-specific tariffs20. For export payments, a meter that can give half-hourly readings, generally a smart meter, is needed to sign up to a tariff that pays for exported solar electricity21. A battery that shifts load into a cheap window and a solar array that exports at an agreed rate both depend on the same metering capability.
The value of a stored kilowatt hour is set by the difference between what the household would otherwise pay and what it paid to charge. Ofgem's price cap is the reference point for that difference. The cap rose 80% from a level of £1,971 in one earlier period, and stood at £1,720 for a typical household before rising to £1,755 in October in a later announcement22. The cap calculation itself has changed over time: Ofgem lowered the household average electricity usage used in the calculation to 2,900 kWh from 3,100 kWh, and 5% VAT is added to the figures24. The electricity unit rate under the cap has moved from 17.19p per kWh in October 2020, and the standing charge stood at 60.12p per day in July 202422.
The direction of travel matters more than any single figure. A cap that rises makes each stored kilowatt hour worth more, because it is avoiding a more expensive import. A cap that falls does the opposite. The cap is a limit on standard variable tariffs, not a fixed price, and households on fixed or time-of-use deals are priced differently.
Solar, export readings and three-phase supplies: how they change the picture
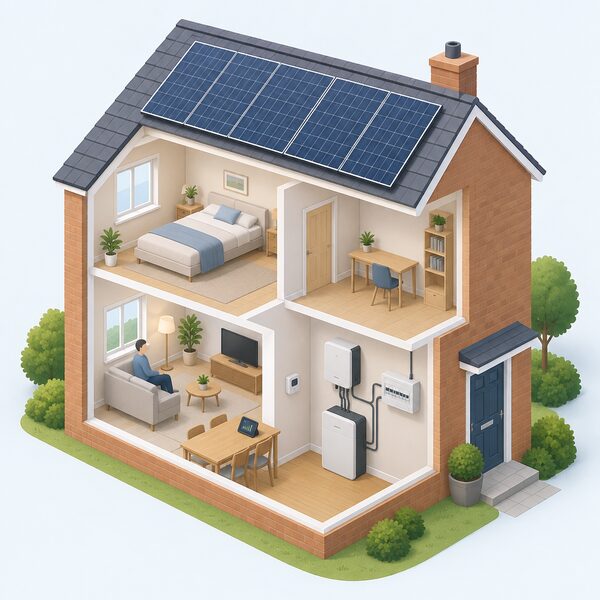
Adding solar changes the sizing question from "how much do we use" to "how much do we generate and when". Great British Energy figures cited in a parliamentary briefing note state that adding a battery to a solar installation increases self-consumption from 30 to 40% to 70 to 80%5. That is the clearest published statement of what a battery does for a solar household: it roughly doubles the share of generation used on site rather than exported.
The sizing implication is that battery capacity should be matched to the surplus generation the household cannot use at the moment it is produced, not to the array's rated output. A large array on a household that is out all day produces a large midday surplus; a battery that can absorb that surplus and release it in the evening captures the self-consumption gain. A battery sized far beyond the daily surplus will spend much of its life part-full.
Export readings are the other half of the solar picture. A meter giving half-hourly readings is needed to sign up to a tariff that pays for exported electricity, and generation payments are not affected by having a smart meter21. A household with solar panels can in most cases get a smart meter, though some suppliers are not yet ready to supply smart meters to customers with solar panels19. One limitation is that the in-home display currently shows only the energy being used and not how much the panels are generating26.
Three-phase supplies change the equipment rather than the arithmetic. A three-phase property can host a larger single battery or several units, and the sizing sum is the same: daily consumption, the shape of the day, the surplus available to charge, and the backup requirement. What differs is the inverter and connection arrangement, which is a matter for the installer and the network operator rather than for the capacity figure itself.
Where smart meters fall short: connection loss, switching and dumb mode
A battery sized on half-hourly data depends on that data continuing to arrive. Smart meters can fail in ways that interrupt it. A meter may stop recording the energy used, or may no longer send readings to the supplier27. The supplier is responsible for maintenance and will fix or replace the meter as needed6. Meters can lose connection with the supplier, lose connection after a change of supplier, or have been installed without being connected to the national communication system29.
Switching supplier is the most common trigger. A meter may not work in smart mode when the household moves to a new supplier, and manual readings may be needed instead30. The first generation of smart meters, known as SMETS1, could temporarily lose smart functionality when switching and stop sending data to the new supplier21. Most SMETS1 meters are now connected to the central smart meter network and have regained their smart functions, which they should keep if the household switches again; those that cannot be connected need replacing21. A meter may work in smart mode again if the household changes tariffs or suppliers30.
There is also a deliberate option to run a meter in dumb mode, with all communications switched off, which a supplier may be able to set up18. That removes the automatic readings and the half-hourly data a battery-friendly tariff depends on, and it is a choice with a cost as well as a privacy benefit.
Data frequency is a household choice. Monthly is the minimum, with daily or half-hourly optional, and if no preference is registered the meter can collect a daily reading18. Half-hourly transmission is what a battery optimisation service needs; monthly readings are enough for billing but not for shifting load against a tariff.
What the Ofgem price cap means for the value of stored electricity
The price cap sets the maximum a supplier can charge for a standard variable tariff, and it is the benchmark against which a battery's avoided cost is measured. Its level has moved sharply: it rose 80% from £1,971 in one period, stood at £1,720 for a typical household before a rise to £1,755 in October in a later announcement, and the electricity unit rate under the cap was 17.19p per kWh in October 2020 with a standing charge of 60.12p per day in July 202424. The cap calculation has itself been revised, with Ofgem lowering the household average electricity usage used in it to 2,900 kWh from 3,100 kWh, and 5% VAT added to the figures24.
For a battery, the relevant figure is not the headline annual bill but the unit rate the household avoids when it discharges. A battery charged in a cheap window and discharged during an expensive one captures the difference between the two rates, and the cap sets the ceiling on the expensive side for households on a standard variable tariff. The cap does not set the cheap side; that is a matter of the tariff the household chooses.
The cap also has a standing charge element, which a battery does not avoid. Standing charges are paid regardless of consumption, so a battery reduces the unit-rate portion of a bill and leaves the fixed portion intact. That distinction matters when a household is estimating what a given capacity will save.
The cap is reviewed periodically, and its level at any moment is a snapshot rather than a forecast. A household sizing a battery is making a decision over a ten to fifteen year horizon, against a cap that will move many times over that period. The evidence supports treating the current cap as the starting value of avoided imports, not as a fixed rate for the life of the system.
How an electric vehicle or heat pump changes the sizing sum
An electric vehicle and a heat pump both add large, flexible electrical loads, and both change the sizing arithmetic in the same direction: more daily consumption, and more of it that can be shifted into a cheap window.
An electric vehicle can be charged on a standard tariff without a smart meter, but some EV-specific tariffs require one20. Those tariffs are the reason an EV often justifies a larger battery: the car's charging load can be moved into the same cheap overnight window the battery uses, and a battery can cover the household's other evening load while the car charges. The sizing question becomes how much of the combined overnight load the household wants to serve from cheap electricity, and how much capacity is needed to hold it.
A heat pump is less flexible than a car charge, because heating demand follows the weather and the household's comfort requirements rather than a convenient overnight window. A heat pump also moves a large share of a home's energy demand from gas to electricity, which is why the gas column in Ofgem's benchmark table matters to a battery sizing decision. A household that replaces a gas boiler with a heat pump will see its electricity consumption rise well above the band it currently sits in, and a battery sized only against today's figure will be undersized for the change.
The two loads together can push a household's daily electricity consumption far above the high band of 3,800 kWh a year, and the sizing sum has to be run against the projected consumption rather than the historical one. The half-hourly data from a smart meter shows the shape of the existing load; the installer's survey is where the projected load from a new heat pump or vehicle is added.
Where a battery sized too large stops paying
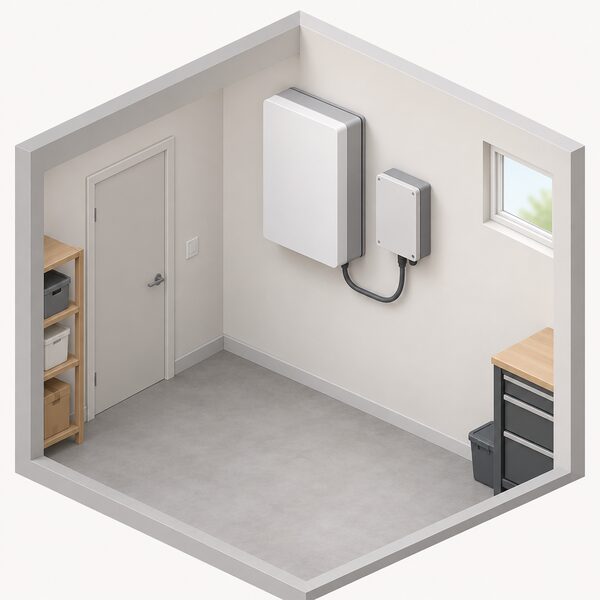
Oversizing has a cost that is easy to miss. A battery that is larger than the household's daily shiftable load will spend much of its life part-full, cycling less than a smaller unit and taking longer to recover its purchase price. The capacity is paid for once, but the savings it generates are capped by the amount of consumption it can actually move.
The sizing headroom figures illustrate the tension. One maker's guidance puts headroom at around 15 to 20% for inverter losses, standby consumption and real-world variation, and separately at roughly 10 to 20% when sizing for essential loads only7. The two figures are not reconciled, and the difference between them is the difference between sizing for the whole house and sizing for the circuits that will run in a power cut. A household that wants whole-home backup needs more capacity than one that wants the lights and the broadband to stay on.
The lifetime figure sets the horizon over which the capacity has to earn its keep. Domestic battery storage has a shorter lifetime of around 10 to 15 years than solar panels5. A battery sized to the household's actual shiftable load will cycle more fully and more often over that period than one sized to a peak that occurs a few weeks a year.
The evidence points to sizing against measured half-hourly consumption rather than against a rule of thumb. A household that knows its daily pattern, its cheap windows and its backup requirement can compare an installer's proposed capacity against all three, and can see where the proposal is sized for the average day and where it is sized for the worst one.
Sources32 cited
- Summary of changes to the energy price cap, 1 October to 31 December 2025, Ofgem, 2025
- How to estimate your energy use, Which?, 2026
- Battery storage, Energy Saving Trust, 2026
- What is a smart meter, Smart Energy GB, 2026
- POST note on domestic battery storage, UK Parliament, 2026
- Smart meters, Welsh Government, 2026
- Energy storage FAQ, Eaton, 2026
- Warm Homes: Social Housing Fund wave 3 scheme guidance addendum, GOV.UK, 2026
- Getting a smart meter, Ofgem, 2026
- How do smart meters save energy, Smart DCC, 2026
- Smart meters vs home energy monitors, Smart Energy GB, 2026
- How can I read a smart meter, Smart Energy GB, 2026
- Uswitch guide to kWh, Uswitch, 2026
- Smart meters and decarbonisation, Smart DCC, 2026
- How to get a smart meter, Smart DCC, 2026
- Get help with your smart meter, Ofgem, 2026
- Smart meters: your rights and expectations, GOV.UK, 2025
- Do I have to accept a smart meter, Which?, 2026
- Smart Energy GB FAQs, Smart Energy GB, 2025
- EV tariffs and home charging: what consumers need to know, Energy Ombudsman, 2026
- Smart meter problems and solutions, Which?, 2026
- About fuel poverty: Ofgem price cap, End Fuel Poverty Coalition, 2026
- Consumer Scotland statement on energy price cap rise, Consumer Scotland, 2025
- The history of Ofgem's energy price cap, Energy Helpline, 2026
- Feed-in Tariffs: generators, Ofgem, 2026
- Myth busting smart meter problems, Smart Energy GB, 2026
- Get help with your smart meter, Ofgem, 2026
- Get help with your smart meter, Ofgem, 2026
- Smart meter performance, Ofgem, 2026
- What happens if your energy supplier goes out of business, Ofgem, 2026
- Upgrading Britain's first generation smart meters, Smart DCC, 2026
- Smart meters, Energy Ombudsman, 2026
 Sizing a Self-Sufficient HomeHow many solar panels and how much battery storage does a home need to stop relying on the grid?
 System SizingMost UK homes need a solar system of around four kilowatts, which takes up roughly twenty square metres of roof.
 Sizing a System With DataWhat does your smart meter data actually show about how your home uses power?
 Capacity and Usable CapacityA battery sold as ten kilowatt hours rarely gives you all ten to use.
 Payback and SavingsHow long until a home battery pays for itself, and why do quoted payback times vary so much?
 Self-ConsumptionHow much of the electricity from your own solar panels do you actually use, and how much goes to the grid?