
In this guide
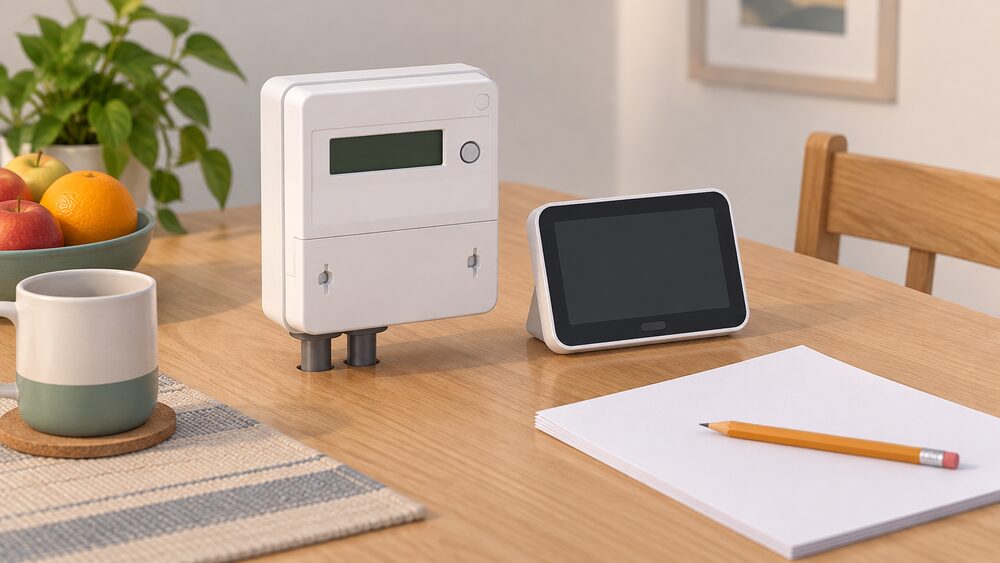
A smart meter records electricity use in half-hour periods and sends those readings to your supplier automatically, which makes it the practical starting point for sizing solar, a battery or a heat pump1. The same half-hourly record that produces an accurate bill also shows the shape of a household's demand: the overnight base load, the evening peak, and how much of the day's consumption could be met by generation or shifted into storage.
Sizing decisions rest on that shape rather than on an annual total. Approved Document L, the building regulations guidance for dwellings in England, states that on-site generation and storage systems "should be an appropriate size for the site, available infrastructure and on-site energy demand"2. A system sized against a real load profile meets that test; one sized against a rule of thumb does not.
The data itself is granular. Electricity readings arrive in half-hour periods, gas usage updates every half hour, and the underlying metering system can record at far finer resolution than that1. What follows sets out what each layer of data shows, how it feeds a sizing calculation, and where the record is too thin to carry the weight.
What a smart meter actually measures and sends
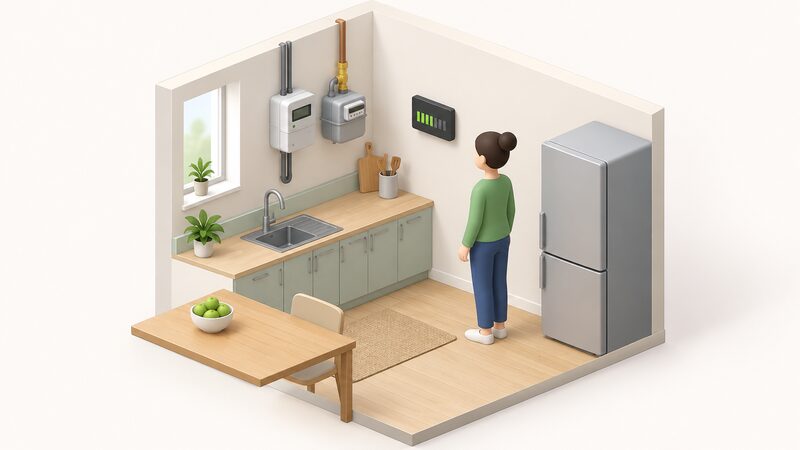
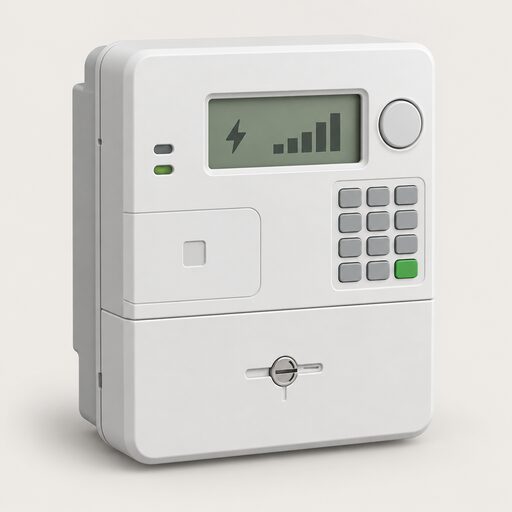
A smart meter measures gas and electricity usage and sends the data directly to the energy supplier4. It is equipped with an in-home display screen, and the meter and display together are intended to help a household monitor and manage consumption4. The meter automatically sends electricity and gas meter readings to the supplier, so manual submission is not normally required8.
The transmission runs over a secure network operated by the Data Communications Company, and readings are sent automatically to the supplier through it9. That matters for sizing because it establishes a continuous, timestamped record rather than a set of spot readings. The data is used to bill for the energy used, to offer new products and services such as new tariffs where permission has been given, and to help make the energy system more efficient by recording demand more accurately8.
Control over that data sits with the consumer. A household controls who can access the energy use data from its smart meter, including how often and for what purpose, except where access is required for regulated purposes such as billing1. Suppliers are automatically allowed access to monthly consumption data to ensure accurate billing, and more detailed access depends on consumer consent5. At the simplest level, smart meter data is commonly described as either "message contents" or "system data"10.
For a household planning generation or storage, the practical consequence is that the detailed half-hourly record exists and can be released, but it is not released by default. The consent decision that governs how that data is shared with third parties is a live regulatory area, and the Consumer Consent Solution is being built to start with smart meter consumption data and expand to other datasets as resources and priorities allow11.
Half-hourly data: the raw material for sizing solar and battery
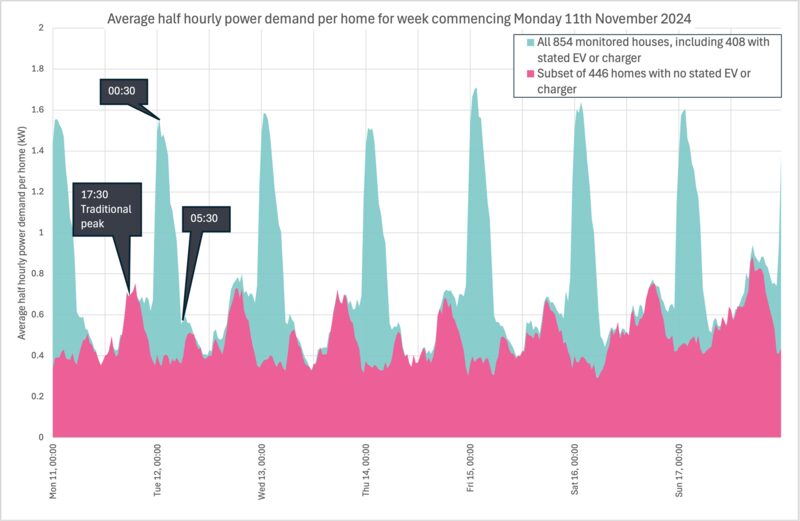
Half-hourly data is the unit that makes a load profile usable. Smart meters enable accurate billing by automatically recording energy use in half-hour periods, allowing suppliers to bill on actual rather than estimated usage1. The same interval structure underpins settlement, demand response and time-of-use pricing, and it is the interval at which a solar or battery calculation is normally run.
The resolution available is finer than the billing interval. Smart meter data recorded at half a second intervals exists within the metering system3, and automatic meter readings can provide the supplier with monthly, weekly, daily or even half-hourly readings12. For sizing purposes the half-hourly series is the useful one: it is long enough to cover a year without becoming unmanageable, and fine enough to separate a morning and evening peak from a flat base.
What the half-hourly series reveals falls into four parts:
- Base load. The consumption that persists overnight, when nothing is deliberately switched on. It sets the floor a battery would have to cover if the aim were to run the house from storage.
- Peak demand. The highest half-hourly figures in the year, usually in winter evenings. These set the maximum instantaneous draw a battery inverter or a heat pump supply has to meet.
- Seasonal shape. The difference between a summer week and a winter week, which determines how much of a year's generation a solar array can actually deliver into the load.
- Daily shape. When consumption happens relative to when generation happens, which is the gap a battery is there to close.
Smart meters also support demand response initiatives, where users can shift consumption to off-peak times13. That capability is what makes a load profile actionable rather than merely descriptive: a household that can move a load can change the profile it is sizing against.
Reading your in-home display and meter readings
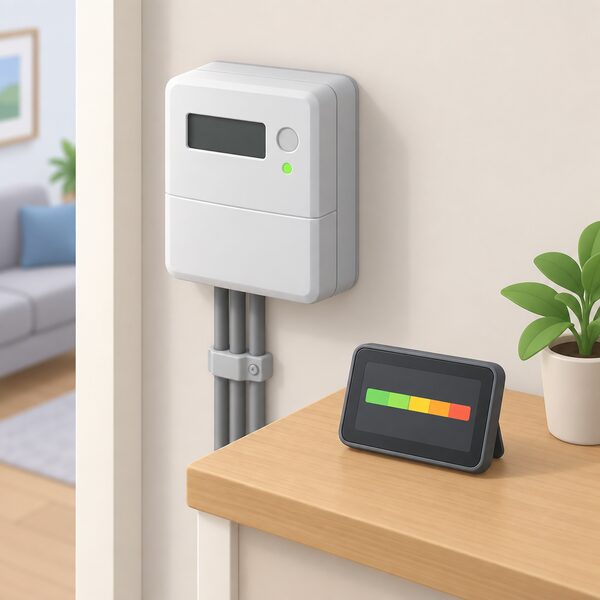
The in-home display shows how much energy is being used during the day14. It is the first and cheapest source of the data a sizing exercise needs, and it is already in the home. The limitation is that it shows the present, not the history: a display is a live indicator, not a record.
The record lives with the supplier and in the meter. A smart meter automatically sends electricity and gas meter readings to the supplier8, and the household does not need to submit readings itself6. Where a meter is not operating in smart mode, manual readings remain possible15. Automatic readings give the supplier monthly, weekly, daily or even half-hourly data12.
For a household assembling a profile, the sequence is straightforward:
- Check the in-home display for the live figure and the daily total.
- Take a manual reading at a fixed time each week if a longer series is wanted.
- Ask the supplier for the half-hourly consumption data, or use a consumer access device to pull it directly.
The consent position governs step three. A household controls who can access its energy use data, including how often and for what purpose, except where access is required for regulated purposes such as billing1. Suppliers hold automatic access to monthly consumption data for billing, with more detailed access dependent on consent5. A consumer access device is the route that keeps the detailed data in the home rather than with a third party, and it is worth understanding before requesting a release.
The in-home display has one further limitation that matters for anyone with generation. Where a household has solar panels, the in-home display will currently only display the energy being used and will not show how much power the solar panels are generating16. A household sizing a battery against its own generation therefore needs a second source for the generation side of the calculation.
From usage data to system size: matching demand to generation
The sizing rule is set out in building regulations guidance: systems should be an appropriate size for the site, available infrastructure and on-site energy demand2. That is a demand-led instruction, and it is the opposite of sizing from a target output. The load profile comes first; the array and the battery follow.
Matching demand to generation means answering three questions from the half-hourly series. How much energy does the household use in a year? When during the day does it use it? And how much of that consumption coincides with the hours when a solar array would be generating? The first figure sets the scale of the system, the second sets the battery, and the third sets the realistic self-consumption rate.
The system itself is designed to be measured. The smart metering system can support up to four smart electricity meters per household, and these can be used as generation meters5. A generation meter measures the total generation produced by an installation, which is the basis on which generation payments have historically been made17. That gives a household a way to verify, after installation, whether the array is producing what the sizing calculation assumed.
Smart meter data is also intended to help make the energy system more efficient by recording demand more accurately18. At household level the same accuracy is what makes a sizing calculation defensible: a system sized against a year of half-hourly readings is sized against the dwelling's actual behaviour, not against a national average.
The technologies and services the data is designed to support include demand side response, time-of-use tariffs, electric vehicles, switching, micro-generation and energy efficiency18. Each of those changes the load profile in a different way, which is why a sizing exercise is a snapshot rather than a permanent answer. Adding an electric vehicle or a heat pump changes the demand the system was sized against.
Battery sizing: using consumption patterns to set capacity
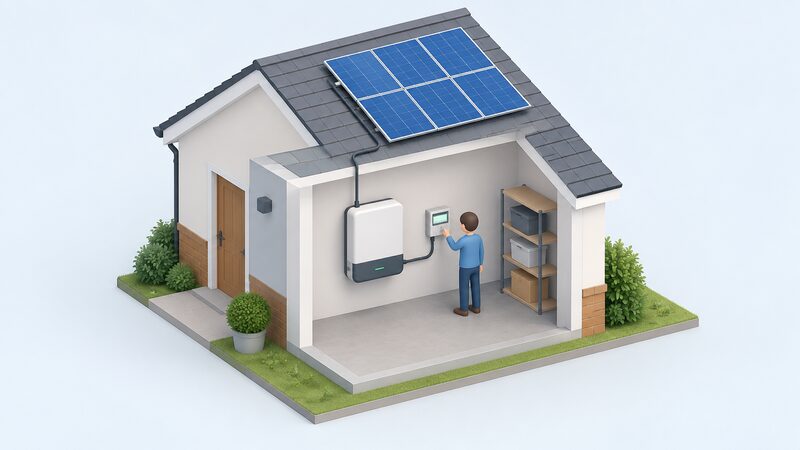
Battery capacity is set by the gap between when energy is generated or cheap and when it is used. The half-hourly series gives that gap directly: the overnight base load sets the minimum useful capacity, and the evening peak sets the maximum useful one. A battery smaller than the base load will cycle fully every night; one much larger than the daily shiftable consumption will sit part charged.
The data that feeds this is the same data that produces the bill. Smart meter data is used to bill for the energy used14, and it is also the source of the up-to-date information on energy use that a household can use to find ways to save money8. Both uses draw on the same record, which is why a household that has already requested its data for billing purposes has most of what a battery sizing exercise needs.
Three consumption patterns drive the calculation:
- The overnight floor. Consumption that runs whatever the household does, which a battery has to cover if it is to carry the house through the night.
- The evening peak. The highest sustained draw of the day, which sets the inverter rating as much as the capacity.
- The weekday and weekend difference. Occupancy changes the shape, and a profile built only on weekdays will misstate the weekend.
Smart meters support demand response initiatives, where users can shift consumption to off-peak times13. Shifting a load changes the profile a battery is sized against, and it is usually cheaper than adding capacity. A household that moves a high-draw appliance into the middle of the day, when a solar array is generating, reduces the storage it needs.
The limit is that the meter measures the whole house, not the circuits within it. A whole-house half-hourly series shows that a load exists but not which appliance causes it. Circuit-level monitoring is a separate exercise, and it is the step that turns a profile into a set of decisions about what to shift, what to store and what to leave on the grid.
Time-of-use tariffs and how they change the sizing sums
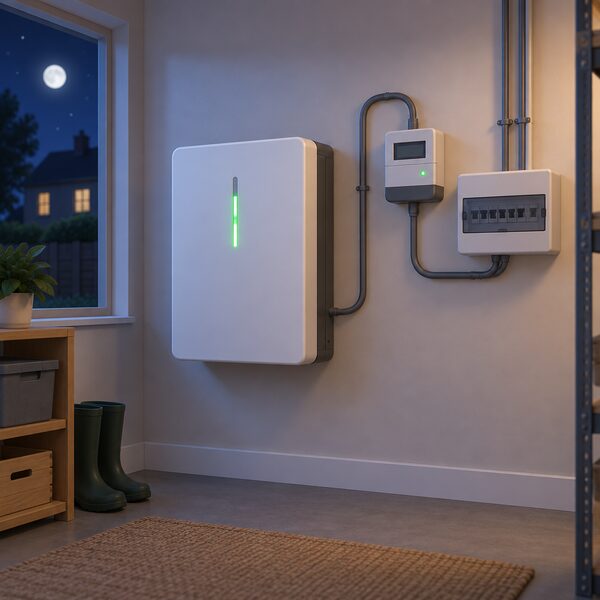
A time-of-use tariff changes the value of storage without changing the amount of energy a household uses. These tariffs use the smart meter to log electricity use and charge different rates during different time windows19. The meter is the enabling device: without half-hourly recording there is no way to bill against a time window.
The effect on sizing is direct. If the cheap window is overnight, a battery is charged in that window and discharged during the expensive one, and its useful capacity is set by the difference between the two. If the cheap window is in the middle of the day, the battery is doing a different job, absorbing generation rather than cheap import. The same physical battery has a different value under each tariff.
The regulatory position links the two. Under the ECO4 guidance, a measure can be combined with a time-of-use tariff and will be used with a functioning electricity smart meter20. The smart meter is a precondition, not an optional extra.
There is a limit on what a household controls here. Except by switching, a household does not control the tariff the energy supplier sets, though it can change how much energy it uses21. A sizing calculation built on a particular tariff structure is therefore built on something that can change. A battery sized to arbitrage one tariff may be oversized or undersized under the next.
The practical position is that time-of-use pricing makes the load profile more valuable, not less. A household that knows its half-hourly shape can see which windows it can move consumption into, and can size storage against the windows rather than against the annual total. The tariff and the battery are a single decision, and the data is what connects them.
Heat pumps: what your gas data tells you before you switch
Gas consumption is the best available proxy for the heat demand a heat pump would have to meet. A smart meter measures gas and electricity usage and sends the data to the supplier4, and gas usage updates every half hour4. That gives a half-hourly heat load profile for the dwelling, in the fuel the heating currently uses.
The conversion from gas to a heat pump is not a straight swap, and the data shows why. Gas consumption includes the losses of a combustion boiler and the energy used to heat water as well as space. A heat pump delivers heat at a lower flow temperature and with a different efficiency, so the useful heat demand is what matters, not the gas meter reading itself. The half-hourly gas series is the input to that calculation, not the answer.
What the gas data establishes before any switch:
- The peak heat demand. The coldest half hours of the year set the capacity the heat pump has to deliver, and they are visible in the winter series.
- The seasonal shape. How much of the year's gas goes on space heating against hot water.
- The daily shape. Whether the dwelling is heated all day or in two blocks, which affects how a heat pump would be controlled.
The electricity side matters too, because a heat pump adds a large new load to the electricity profile. A household sizing a heat pump alongside solar and a battery is sizing one system, not three: the heat pump raises winter electricity demand at exactly the time solar generation is lowest. The half-hourly electricity series shows the headroom available and the half-hourly gas series shows the load to be added.
The limit is that the gas series describes the dwelling as currently heated, including its insulation, its glazing and its control settings. A heat pump sized on the current gas profile is sized on the current building. Fabric improvements change the profile, and the sizing exercise has to be repeated if they are made.
Smart meters and solar panels: compatibility and export readings
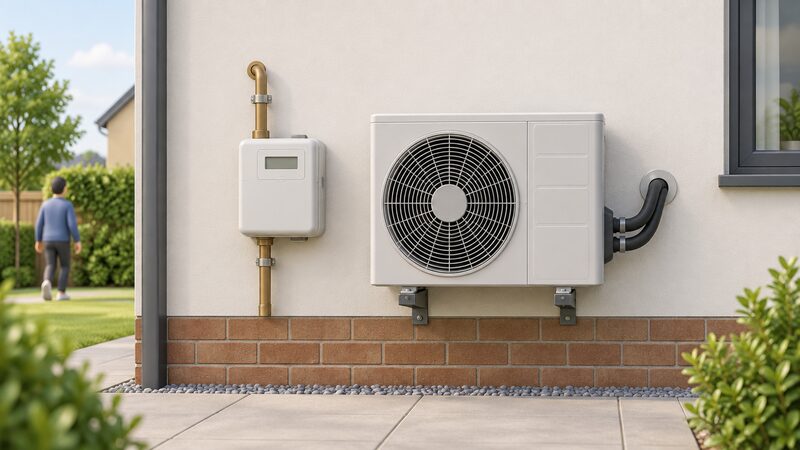
A smart meter can be installed in a home with solar panels, though some suppliers are not yet ready to supply smart meters to customers with solar panels16. The compatibility is a matter of supplier readiness rather than a technical barrier.
The metering system is built for generation. It can support up to four smart electricity meters per household, and these can be used as generation meters5. A generation meter measures the total generation produced by an installation, which is the basis for generation payments17. That means a household with solar can have both an import meter and a generation meter, and the two together give the full picture: what the array produced and what the house drew from the grid.
The gap is on the display side. Where a household has a smart meter and solar panels, the in-home display will currently only display the energy being used and will not show how much power the solar panels are generating16. A household wanting to see generation in real time needs a separate monitor or the inverter's own app.
Export measurement is the other half of the picture. The smart metering system's ability to measure exported energy from microgeneration is part of its design5. For a household sizing a battery, the export figure matters because it shows how much generation currently leaves the property without being used. That surplus is the energy a battery would capture, and its size is the first estimate of useful storage capacity.
The practical sequence for a household with panels is to establish the generation total from the generation meter, the import total from the smart meter, and the half-hourly shape of both. The difference between generation and coincident consumption is the surplus, and the surplus is what a battery is for.
Where smart meter data falls short for sizing
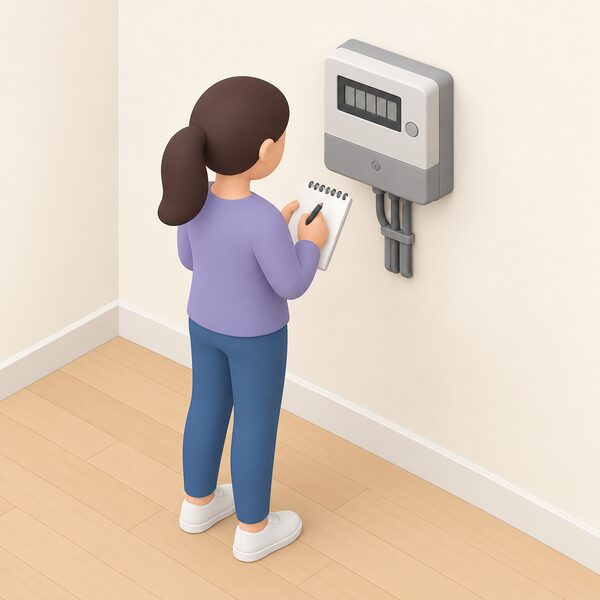
The half-hourly record is a good instrument with known blind spots, and a sizing exercise that ignores them will be wrong in predictable ways.
- It measures the whole house, not the circuits. A half-hourly series shows that a load exists but not which appliance causes it. Circuit-level monitoring is a separate exercise.
- It shows no generation on the display. An in-home display will currently only show the energy being used, not how much the solar panels are generating16.
- It is consent-dependent at detail level. Suppliers hold automatic access to monthly consumption data for billing, and more detailed access depends on consumer consent5.
- It describes the dwelling as it is. A profile built before an electric vehicle, a heat pump or fabric improvements is a profile of a different house.
- It is not always available. A smart meter may stop recording the energy you use, or may no longer send readings to your supplier8. Where that happens, the series has a gap.
The consent point deserves emphasis because it is the one a household controls. A household controls who can access the energy use data from its smart meter, including how often and for what purpose, except where access is required for regulated purposes such as billing1. That control is what allows detailed data to be released to an installer or an analyst for a sizing exercise, and it is also what allows it to be withheld.
The data categories themselves are a limit on interpretation. Smart meter data is commonly described as either "message contents" or "system data"10, and the two carry different levels of detail. A household asking for its data should be clear which it is asking for.
The rollout: availability, costs and what happens next
The rollout is being implemented by energy suppliers across the country, who are installing millions each year22. Installation is free to the household6. Any household that pays for energy, whether owning or renting, should be able to book a smart meter installation where it is expected to work in the property1. Private renters can choose one if the energy bills are in their name or they prepay for energy, after checking the tenancy agreement and letting the landlord know23.
Progress has been steady rather than complete. The proportion of meters in homes that are smart rose from 62% in August and September 2023 to 68% in January 202524. The government's proposal was for 80% of homes to be smart by the end of 20257. The original programme envisaged over 50 million meters to be installed in 30 million premises25.
The framework is moving to a completion phase. Once the Department considers the rollout complete, it will pass responsibility for smart metering to Ofgem and the Smart Energy Code governance26. Large energy suppliers are required to develop their approach to installation as the programme progresses27. The programme has committed to reviewing opportunities to use observed data in place of model assumptions ahead of reporting on the rollout to the end of 2025, and has used supplier data to derive market-wide average installation and asset costs for the years 2020 to 202428.
Two dates matter for anyone sizing a system now. Meters still connected to 2G and 3G must be replaced before those services are switched off by 203329, and communications hubs using 2G or 3G need replacement with 4G-capable devices by the end of 203328. Separately, smart meters will switch seamlessly to the 2G network, so a meter continues to operate as normal following the 3G switch-off30.
For a household, the rollout position determines how much data is available and how far back it goes. A meter installed recently has a short history; a household that wants a full year of half-hourly data before sizing a system may need to wait for it to accumulate, or to rely on a shorter series and accept the uncertainty.
Sources30 cited
- Smart meters: your rights and expectations, GOV.UK, 2025
- Approved Document L, Volume 1: Dwellings, GOV.UK, 2026
- Smart meter data, Parliamentary Office of Science and Technology, 2026
- Smart meters, Welsh Government, 2026
- Written evidence on smart meters, UK Parliament, 2016
- Getting a smart meter, Ofgem, 2026
- Update on the rollout of smart meters, National Audit Office, 2023
- Get help with your smart meter, Ofgem, 2026
- How do smart meters save energy?, Smart DCC, 2026
- How do smart meters send readings?, Smart DCC, 2026
- Consumer Consent Decision, Ofgem, 2025
- How to get a smart meter, Smart DCC, 2026
- How do smart meters reduce my bills?, Smart DCC, 2025
- Get help with your smart meter, Ofgem, 2026
- Smart meter performance, Ofgem, 2026
- Myth busting smart meter problems, Smart Energy GB, 2026
- Feed-in Tariff guidance for renewable installations, Ofgem, 2016
- Smart meters: unlocking the future, GOV.UK, 2018
- Five top tips to cut your energy bills, Welsh Government, 2026
- ECO4 new measures and products guidance, Ofgem, 2026
- What happens if your energy supplier goes out of business, Ofgem, 2026
- Do you have to have a smart meter by law?, Smart DCC, 2026
- Smart meters, Energy Ombudsman, 2026
- What drives consumer satisfaction with energy suppliers, Ofgem, 2025
- Second annual progress report on the roll-out of smart meters, GOV.UK, 2013
- Smart metering implementation programme, Public Accounts Committee, 2023
- Decision to amend the framework regulating large energy suppliers, Ofgem, 2017
- Smart Metering 2025 Costs and Benefits Report, UK Parliament, 2025
- Tough new rules force suppliers to fix faulty smart meters, GOV.UK, 2026
- Do smart meters use 3G?, Smart DCC, 2024
 Baseline Your Energy UseBefore spending money on a heat pump, solar panels or a battery, you need to know what your home actually uses now.
 Smart Meter Data and Who Sees ItWhat does your smart meter actually record, and who gets to see it?
 What Size Battery?How much electricity does your home use in a day, and how much of that falls in the hours when power is cheap or your solar panels are generating?
 Who Owns Your Home Energy DataYour smart meter records how much gas and electricity you use, and that information belongs to you, not your supplier.
 Behind-the-Meter SystemsWhere does your meter sit, and what does that mean for the solar panels or battery you put in at home?
 Solar and Battery MonitoringWhat does your solar and battery app actually show you, and can you trust it?