In this guide
A home energy monitor costs nothing at the bottom of the market and more than £60 at the top, and the difference is not about accuracy so much as what the device can see. A smart meter comes with a free in-home display that shows electricity and gas use in near real-time. A standalone plug-in monitor can cost less than £10. A whole-home monitor that clamps around the supply cables typically costs more than £60, and solar-specific monitoring runs from £100 to £400 depending on the type1.
The running cost of the free option is small: less than £2 a year to power an in-home display4. The paid options carry their own ongoing costs, and some wireless monitors need subscription apps or extra accessories depending on the manufacturer6. What a household gets for the money is a question of circuits, accuracy and data history, and whether the data stays in the home or sits in a maker's cloud.
This page sets out the price bands, what drives them, who fixes what under warranty, and what the evidence says monitoring actually saves. It also states plainly where the dependence remains: on a supplier, on a meter, on a manufacturer's app, and on the grid.
What a home energy monitor costs: from free to over £60
The price of monitoring splits into four bands, and each band buys a different level of visibility. At the bottom, a smart meter and its in-home display arrive at no extra cost, because getting a smart meter installed is free for UK energy customers and the display comes with it7. That is the only genuinely free route, and it is tied to having a smart meter fitted.
Above that sit plug-in monitors. Cheap models can be found for less than £10, though Which? advises checking that a cheap unit has the features needed before buying1. A standalone energy monitor of the kind sold for general household use costs around £30 to £40 and is easy to install yourself2. Northern Ireland's official energy efficiency guidance puts the retail range wider, from £30 to over £100 across the monitors different retailers sell9.
Whole-home monitors, which hook up directly to the home power supply rather than to a socket, typically cost more than £60 and require a wi-fi connection and a smartphone to operate1. These are the devices that can see individual circuits rather than a single appliance. At the top of the range, solar energy monitors cost between £100 and £400 depending on the type3.
The spread reflects what is being measured. A plug-in monitor measures one socket. A clamp monitor measures the whole supply. A circuit-level monitor measures each breaker. The hardware cost rises with the number of measurement points, the current transformers needed, and whether the unit is designed to sit inside a consumer unit.
The free option: an in-home display with your smart meter
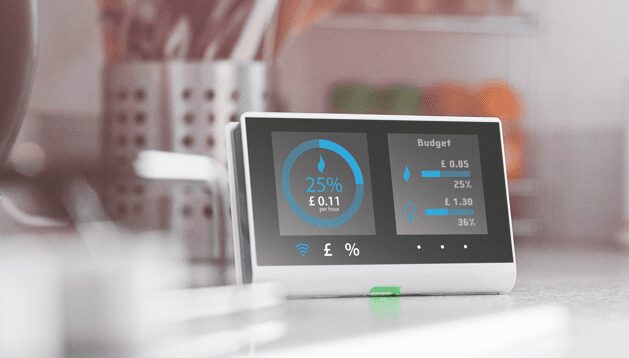
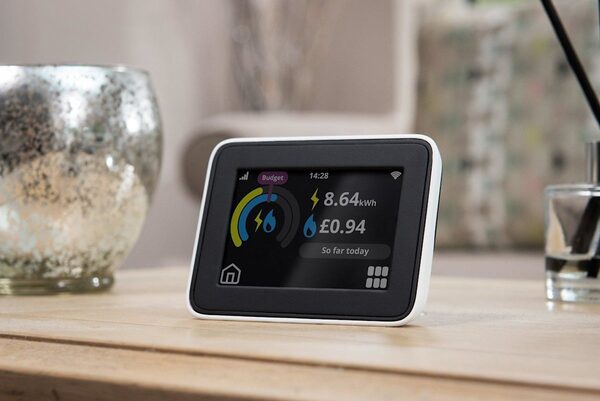
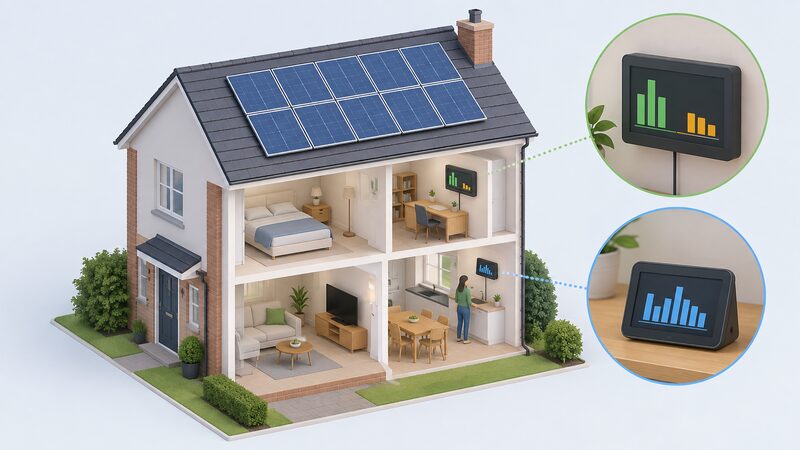
The cheapest monitoring in a UK home is the one already installed. Smart meters come with an in-home display so consumers can see and manage energy use, and the display shows how much energy is being used during the day10. In Wales, official guidance describes smart meters as equipped with an in-home display screen that helps monitor and manage consumption efficiently12.
The display is not a separate purchase. A smart meter and accompanying in-home display can be installed by your energy supplier at no extra cost, and the display is described as coming with the meter8. That makes the in-home display the default monitoring device in any home that has accepted a smart meter, and it costs nothing beyond the standing charges already on the bill.
What it shows is narrower than a paid monitor. It displays how much gas and electricity is being used in kilowatt hours and its cost in as near to real-time as possible13. It updates in near real-time for electricity and every half hour for gas14. It shows how much energy was used in the last hour, week and month, and what that cost15. It should also take standing charges into account and include them in the costs shown5.
The limitation is scope, not accuracy. The display is designed to provide a close real-time estimate of energy usage and costs based on the information received from the smart meter6. It is an estimate derived from meter data, not a direct measurement of each circuit, and it cannot break consumption down by appliance. For a household that wants to know the total and the trend, that is enough. For one that wants to know which circuit is drawing the power, it is not.
Running costs: less than £2 a year for an in-home display
The in-home display is cheap to run. It costs less than £2 per year to run, and the units have been designed to be as efficient as possible4. Smart Energy GB gives the same figure, stating that it costs less than £2 per year to power a smart meter in-home display5. That is the whole running cost of the free monitoring route: no subscription, no cellular fee, no app charge.
Paid monitors are different. Some wireless energy monitoring devices may also require subscription apps or additional accessories depending on the manufacturer6. That is the ongoing cost that a purchase price does not reveal. A monitor that depends on a cloud service to store history or to run automations may stop working as intended if the subscription lapses or the service changes.
Cellular connectivity is the other recurring cost to watch. A device that reports over a mobile network rather than the home wi-fi needs a data plan, and that cost sits with the household. A device that uses the home wi-fi avoids it but depends on the broadband connection staying up. The Smart Metering system itself does not need wi-fi, since smart meters communicate over their own network16, but a third-party monitor generally does.
The comparison is stark. The free route costs under £2 a year in electricity and nothing else. A paid route costs the purchase price plus, in some cases, a subscription and the electricity to run the device. That does not make the paid route poor value, but it means the case for it rests on what it can see that the free display cannot, not on the cost of running it.
Plug-in monitors, whole-home monitors and supplier tools: which costs what
The three paid routes differ in what they measure and what they cost to fit.
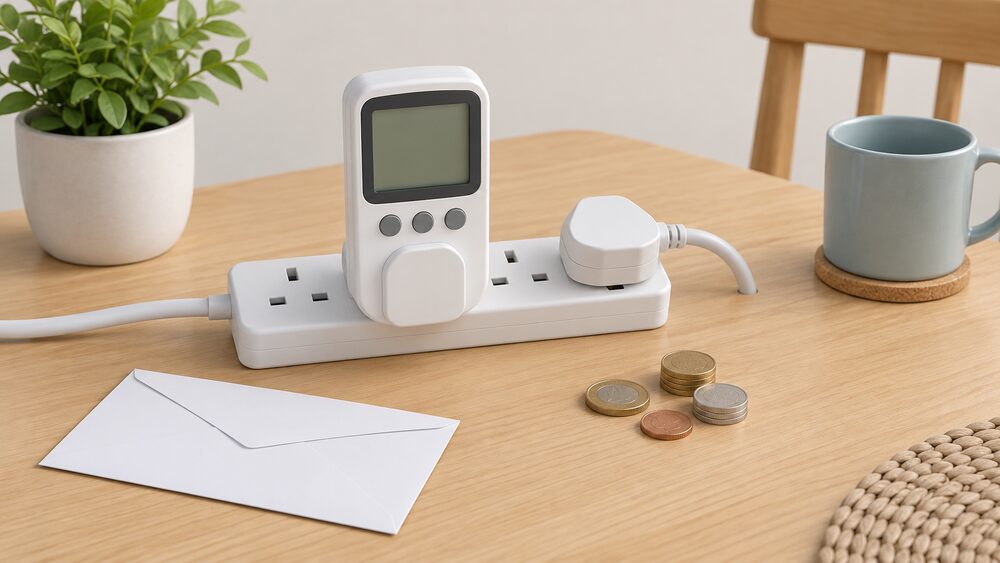
A plug-in energy monitor sits between the wall socket and the appliance. The monitor plugs into the wall socket and the appliance plugs into the monitor; for multiple devices, they go into an extension lead and the lead plugs into the monitor1. It works with almost anything that uses electricity as long as it has a three-pronged UK plug, including kettles, washing machines and electric ovens1. A single monitor can be moved from device to device: leave a device plugged in for just a few days to assess its typical usage, then switch the monitor to another device, so there is no need for one monitor per appliance1. At less than £10 for cheap models, this is the lowest-cost way to measure a specific appliance1.
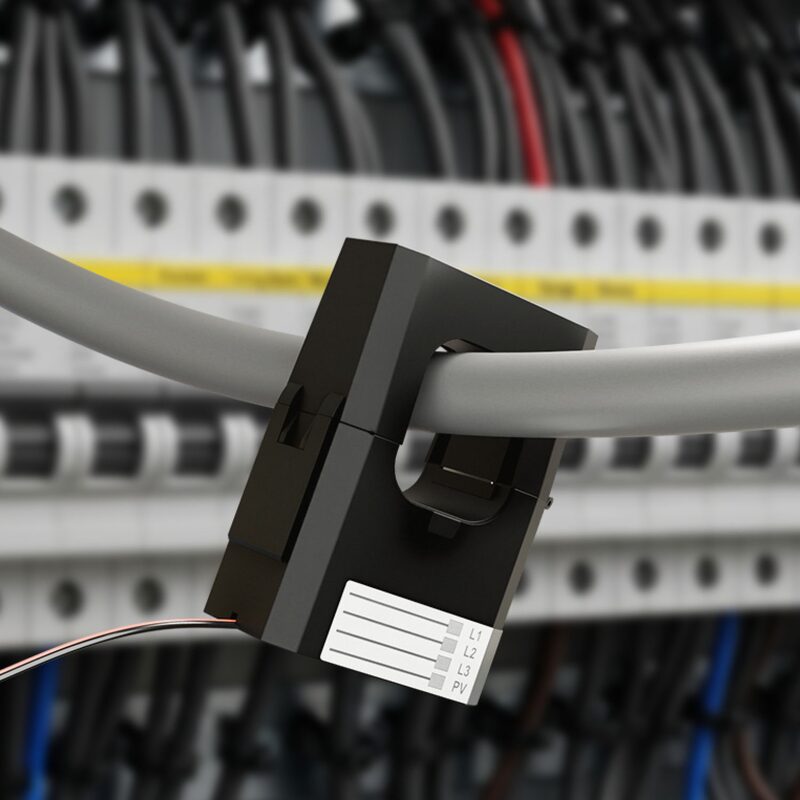
A whole-home monitor clamps around the supply cables at the meter or consumer unit. These typically cost more than £60 and need wi-fi and a smartphone1. Fitting inside a consumer unit is electrician work, and the cost of that time is quoted by the installer rather than published. A clamp that goes around the meter tails outside the consumer unit is a simpler job, but any work near the supply is not a DIY task.
Supplier tools are the third route and cost nothing extra. Energy monitors, including brands such as Smappee and Owl, allow you to see your electricity use in near real-time8. Some third-party home energy monitors may offer more detailed electricity insights, depending on the system6. The distinction that matters for cost is that a supplier's own app or display is funded through the existing relationship, while a third-party monitor is bought privately at your own cost, and some may need to be set up by an electrician6.
| Route | Typical cost | What it measures | Fitting |
|---|---|---|---|
| In-home display with smart meter | Free with installation7 | Whole-home electricity and gas, near real-time | By the supplier8 |
| Plug-in monitor | Less than £10 for cheap models1 | One socket or one extension lead | Self-installed2 |
| Standalone monitor | Around £30 to £402 | Whole-home electricity | Self-installed2 |
| Whole-home clamp monitor | More than £601 | Whole-home, sometimes per circuit | Wi-fi and smartphone required1 |
| Solar monitor | £100 to £400 depending on type3 | Generation and export | Varies by type |
What you get for the money: circuits, accuracy and data history
The purchase price buys three things: how many circuits are visible, how accurate the measurement is, and how much history is kept.
Circuits are the clearest dividing line. A plug-in monitor sees one socket. A whole-home clamp sees the total. A circuit-level monitor sees each breaker separately, which is what allows a household to attribute consumption to a particular load rather than to the house as a whole. The Meross Smart Energy Monitor EM16P supports monitoring of up to 18 circuits, and its package includes two 200A current transformers and sixteen 60A current transformers to fit them17. That is the hardware that the price reflects.
Accuracy is stated by makers rather than by regulators for third-party monitors. The EM16P is quoted with an error margin within ±2%17. The in-home display, by contrast, is described as designed to provide a close real-time estimate of energy usage and costs based on the information received from the smart meter6. Neither is a billing instrument: the meter is. A monitor is a diagnostic tool, and its accuracy matters for comparing one circuit with another rather than for settling an account.
Data history is the third element and the one most often tied to a subscription. The EM16P offers free cloud storage supporting up to five years of exportable historical data at daily level17. A monitor without that history can show the present but not the pattern, and the pattern is what makes a monitor useful for sizing a solar array or a battery.
The in-home display covers the basics of history: it shows how much energy was used in the last hour, week and month, and what it cost15, and it can show historical energy use, set a budget, show meter readings and display tariff information18. What it cannot do is separate the circuits.
Meross EM16P and EM06P: specifications at a glance
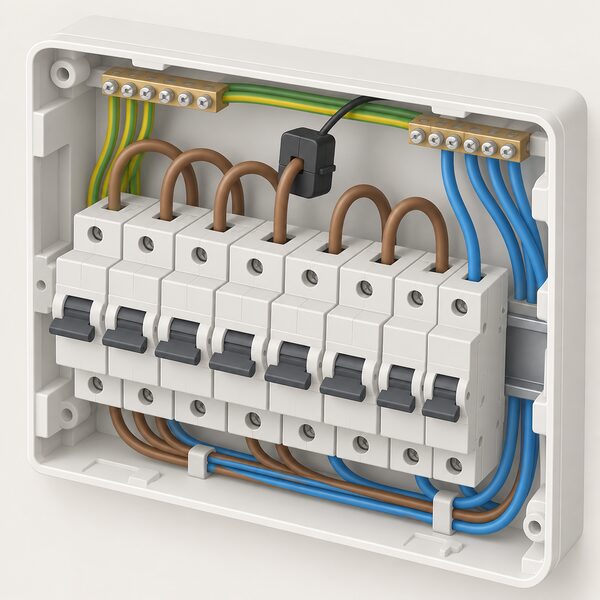
The Meross EM16P is the circuit-level model in the maker's range, and its published specification shows what the higher price band buys. It provides 24/7 insights into home electricity usage, supports consumption and feed-in monitoring, and gives monthly, weekly and daily energy statistics17. A Merge Channel feature is included so that viewing total home energy usage is simpler17.
| Specification | Meross Smart Energy Monitor EM16P |
|---|---|
| Circuits monitored | Up to 1817 |
| Measurement accuracy | Error margin within ±2%17 |
| Monitoring modes | Consumption and feed-in, with monthly, weekly and daily statistics17 |
| Solar PV monitoring | Supported, with automations for zero feed-in17 |
| Home Assistant | Native support, no flashing, warranty retained17 |
| Cloud storage | Free, up to 5 years of exportable historical data at daily level17 |
| Data export | Daily, hourly or minute-level formats17 |
| Three-phase power | Supported17 |
| Certifications | ETL certified, compliant with UL 6101017 |
| Dimensions (W x D x H) | 4.5 x 3.5 x 1.1 in. (monitor size)17 |
| Stock status | In stock, ready to ship17 |
| Customer rating | 5.0 from 5 total reviews17 |
The package contents show where the cost sits: one smart energy monitor, one wi-fi antenna assembly, two 200A current transformers, sixteen 60A current transformers, insulation plugs, wire nuts, extra wire, a power harness, a circuit label and a user manual17. The current transformers are the bulk of the bill of materials, and a household with fewer circuits needs fewer of them.
The EM06P is the other model named in the range. The published specification for the EM16P is the one set out above; where a figure is not given for a model, none is stated here.
Solar PV and zero-export monitoring: when a paid monitor earns its keep
Solar is where a paid monitor starts to justify its cost, because the free in-home display cannot see generation. If you already have a smart meter and solar panels, the in-home display will currently only display the energy you are using and will not show how much power the panels are generating14. It shows how much energy you are buying from your supplier, and may in future also reflect self-generated energy10. Generation monitoring therefore needs separate equipment, which is why solar monitors cost between £100 and £400 depending on the type3.
What that equipment enables is export control. The EM16P supports solar PV monitoring and works with automations in the app or Home Assistant to achieve zero feed-in17. Zero feed-in means diverting generation to a load rather than exporting it, which matters where export is not paid or is paid poorly.
The value of export varies by nation and by roof. Which? modelling of a 4.6kWp ten-panel system on a south-facing, 35-degree pitched roof with no shading gives annual Smart Export Guarantee payments of £370 in London, £335 in Edinburgh and £390 in Cardiff, with payback times of 11 years 3 months, 12 years 2 months and 10 years 11 months respectively19. The same system east-facing with modest shading gives £235 in London and £200 in Edinburgh, with payback of 16 years 1 month and 18 years 0 months19. The gap between a good roof and a poor one is larger than the cost of the monitor.
That is the case for paid monitoring on a solar home: it is the instrument that shows whether generation is being used or exported, and it is the input to any automation that shifts the balance. The Energy Ombudsman's guidance on feed-in tariffs covers the separate question of payments under older schemes20.
Warranty and replacement: who fixes what, and for how long
The in-home display carries a 12-month warranty. If a fault is reported within 12 months of installation and is not due to the household failing to keep the display in good working order, the supplier must repair or replace it free of charge21. Smart Energy GB puts it the same way: if installation was within the last 12 months, the supplier may replace the display free of charge, though accidental damage charges may sometimes apply14.
After that window, the position changes. Energy firms are allowed to charge for a replacement monitor after 12 months and it is up to them to set their own price22. The Ivie Bud in-home display, available for EDF Energy and E.ON Next customers, has a 12-month warranty covering replacement of the monitor or a refund of the price paid if a fault occurs within 12 months, subject to exclusions22.
The meter itself is a separate matter from the display. Unless a consumer has offered to supply an appropriate meter themselves, the energy company must ensure the installation and maintenance of an appropriate meter, and must investigate notified issues at the earliest opportunity, including re-billing based on undisputed readings20. So a faulty meter is the supplier's responsibility, while a faulty display is the supplier's responsibility for 12 months and then a chargeable item.
For third-party monitors, the warranty is the maker's. The EM16P's native Home Assistant support is stated to keep the full warranty, which matters because flashing firmware to add local control can void cover on other devices17. A household weighing a paid monitor should read the warranty term as part of the price, since a monitor that fails outside cover is a replacement cost rather than a repair.
Data export, retention and Home Assistant: owning your own energy data
Whether a household owns its energy data depends on where the data sits. The EM16P keeps free cloud storage supporting up to five years of exportable historical data at daily level, and data can be exported in daily, hourly or minute-level formats17. That is a maker's cloud service, so the retention and the export depend on the maker continuing to run it.
Local control is the alternative. The EM16P natively supports Home Assistant with no flashing required, while still keeping the full warranty17. Native support means the data can be pulled into a local system without modifying the device, which is the difference between a monitor that reports to a cloud and one that reports to the home.
The boundary between monitoring and metering is worth stating. A home energy monitor can help track electricity use, but it does not replace a smart meter because it cannot automatically send meter readings to your supplier6. Monitors and smart thermostats are not linked to your energy accounts and do not send any information to your energy suppliers16. So a monitor adds visibility without changing the billing relationship, and the readings that reach the supplier still come from the meter.
That has a practical consequence for independence. A monitor gives a household its own view of consumption, which is the input to deciding whether to shift load, add a battery or change a tariff. It does not reduce dependence on the grid, the supplier or the meter. The dependence that remains is on the maker's app or cloud for any monitor that stores history there, and on the home's wi-fi and broadband for any monitor that reports over the local network16.
What monitoring could save you: the Energy Insights evidence
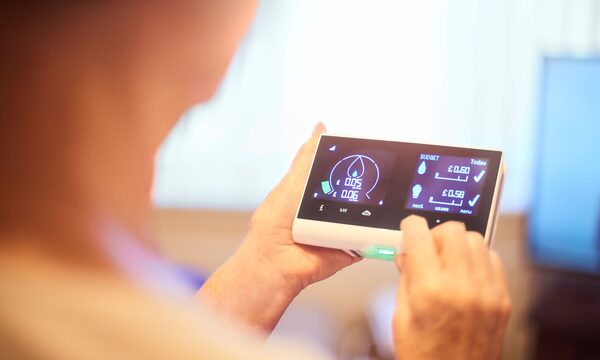
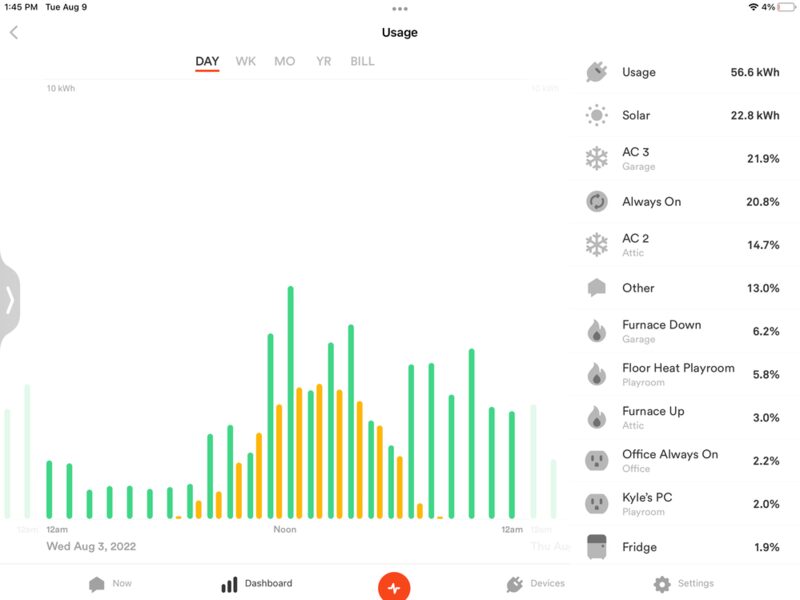
The saving from monitoring comes from behaviour, not from the device. People who fit home energy monitors tend to find their energy use drops by between five and 15 per cent in the first year of use, which could be £25 to £75 off a £500 bill9. That is the official figure, and it is a range rather than a promise.
The mechanism is feedback. With near real-time data, a household sees how much energy is being used as it happens23. The in-home display lets a household know how much energy is being used in near real-time and how much it is costing in pounds and pence14. Seeing the cost of a load while it runs is what changes behaviour, and the effect is largest in the first year.
The caution is that the device alone does nothing. Simply buying and plugging in an energy monitor will not automatically reduce bills, and claims by a seller or manufacturer that a monitor saves energy and cuts bills should be treated with scepticism1. The saving is contingent on acting on what the monitor shows.
For context on what is being managed, wholesale energy and supplier costs together make the biggest component of UK domestic electricity price24. A household cannot change that component, but it can change how much of it applies to them. Energy supplier schemes and grants fund making energy-saving improvements to a home25, and a smart meter can help a household find ways to save money using up-to-date information on energy use11.
The honest summary is that monitoring is an information purchase. It costs nothing at the bottom, under £2 a year to run, and £30 to over £100 at retail for a standalone device4. The return is the five to 15 per cent reduction in use that follows from acting on the data, and that return is not guaranteed by the purchase9.
Sources25 cited
- Are energy monitors the best way to measure your power usage?, Which?, 2026
- Energy monitors, Centre for Sustainable Energy, 2026
- Making the most of your solar PV panels, Centre for Sustainable Energy, 2026
- Understanding smart meters, National Energy Action, 2026
- Do smart meters cost more?, Smart Energy GB, 2026
- Smart meters vs home energy monitors, Smart Energy GB, 2026
- Does a smart meter save money?, Smart DCC, 2024
- Do I already have one?, Smart Energy GB, 2026
- Energy efficiency tips, nidirect, 2026
- Smart meters: your rights and expectations, GOV.UK, 2025
- Get help with your smart meter, Ofgem, 2026
- Smart meters, Welsh Government, 2026
- Does a smart meter need wi-fi?, Smart DCC, 2026
- Myth-busting smart meter problems, Smart Energy GB, 2026
- What is a smart meter?, Smart Energy GB, 2026
- Get help with your smart meter, Ofgem, 2026
- Smart Energy Monitor EM16P, Meross, 2026
- How to use your smart meter data, Which?, 2026
- Are solar panels worth it?, Which?, 2025
- Feed-in tariffs, Energy Ombudsman, 2026
- Smart meters, Energy Ombudsman, 2026
- Why your energy company isn't fixing your smart meter monitor, Which?, 2024
- How do smart meters save energy?, Smart DCC, 2026
- Consumer bills, UKERC, 2026
- Get help with your energy bills, Ofgem, 2026
 Home Energy MonitorsWhich home energy monitor suits your house, and what will it actually show you?
 What a HEMS DoesWhat does a home energy management system actually do, and is it worth having one?
 Meters and Energy IndependenceDo smart meters really save you money, and can you still get one fitted for free?
 Three-Phase MeteringYour home has a three-phase supply.
 The Full Smart Meters GuideDo smart meters really save you money, and how do you use one to cut your bills?
 In-Home DisplaysWhat does the little screen that came with a smart meter actually tell you, and what can you do when it stops working?