In this guide
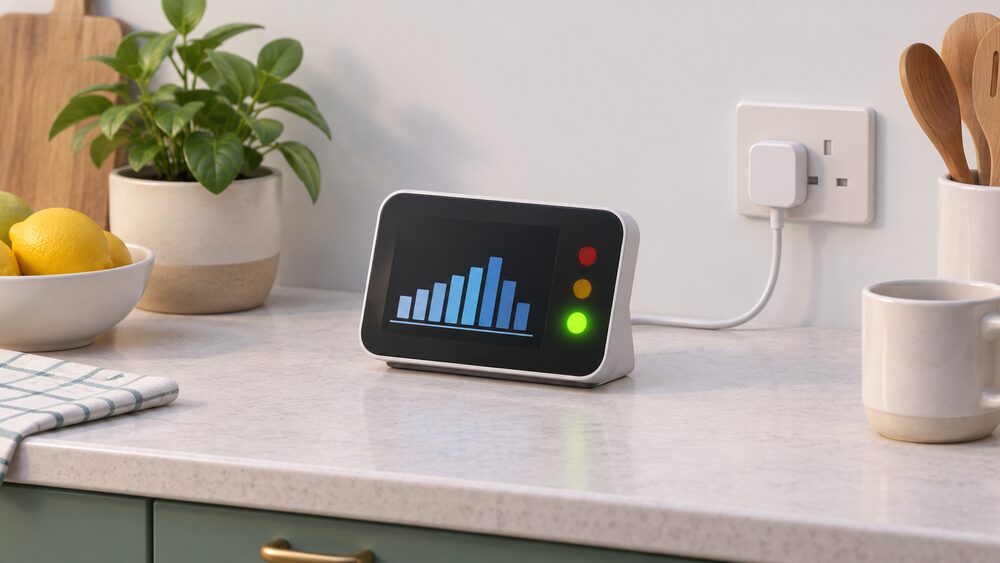
An in-home display (IHD) is a small portable screen that shows how much energy a home is using and what it is costing1. Everyone who has a smart meter installed in Great Britain is provided with one, and it works in either of the two ways people pay for energy: credit, billed monthly or quarterly, or prepay2. It is not the meter itself: the meter stays fixed in its cupboard, while the display can sit anywhere in the house within range1.
The screen updates in near real time for electricity and every half hour for gas3. Smart Energy GB puts the electricity interval at every 10 seconds4. It costs less than £2 a year in electricity to run5. If it develops a fault within its 12-month warranty the supplier could repair or replace it6, and after that a new one is expected to cost in the region of £30 to £507.
For household energy independence, the display is a window rather than a control: it lets a household see its demand clearly, which is the starting point for cutting it, but it controls nothing, it is tied to one meter and one property, and after the first year its upkeep depends on the supplier's goodwill or the household's own money.
What an in-home display is, and what it is not
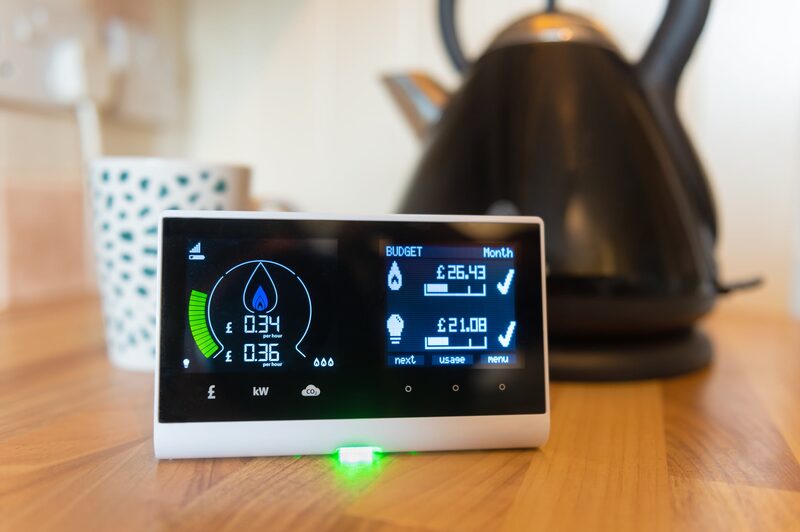
The device goes by several correct names: in-home display (IHD), smart meter display or smart meter monitor9. It connects wirelessly to the home's gas and electricity smart meters and uses that link to show consumption and cost10. It is offered at the point of installation, and it is not compulsory: Smart Energy GB states "You don’t have to have one", while calling it the easiest way to see what energy is being used and what it costs11.
Three things it is not are worth stating plainly.
- It is not the meter. The meter is fixed in position, usually in a cupboard inside or outside the home, and it is the meter that records the readings used for billing1.
- It is not a bill. Smart Energy GB describes the display as "for information only"; households still receive regular bills in the same way, now based on actual readings rather than manual ones5.
- It is not a recorder. The display simply shows data from the smart meter and cannot record information of its own4. Changing its settings does not affect the readings sent to the energy company12.
Nor is it something the household buys as a separate item in the usual sense. In a 2014 paper on cooling-off rights, Ofgem took the view that ancillary goods such as an in-home display, supplied as part of a gas and electricity contract, are unlikely to make that contract a sales contract where the consumer does not acquire ownership of the goods or make a separately identifiable payment for them13. That older regulatory position helps explain why the display is treated as part of the smart metering set-up for the property rather than as the occupant's own gadget, a theme that runs through the rules on moving house and switching supplier below. For how the meter it talks to works, see how smart meters work.
The screen shows kWh and pounds and pence in near real time
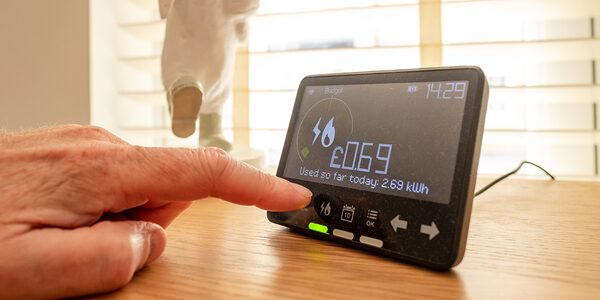
Every display, whatever its make, provides the same essential information: energy use in pounds, pence and kilowatt-hours (kWh)14. The Data Communications Company, which runs the smart metering network, describes the device as showing "how much gas and electricity is being used in kilowatt hours (kWh) and its cost in as near to real-time as possible"15. Householders can choose which unit to view16; on the Trio Touchbutton display, for example, one button switches between pounds and pence and kilowatt-hours17.
Beyond the live figure, displays show estimated costs and daily, weekly and monthly usage trends18, including how much was used in the last hour, week and month and what it cost3.
The update speed differs sharply by fuel, and this shapes what the screen is useful for:
| Fuel | How often the display updates | Source |
|---|---|---|
| Electricity | Near real time; every 10 seconds | 4 |
| Gas | Every half hour (about 30 minutes) | 19 |
Electricity's short interval means switching on a kettle or oven shows up almost immediately, which is why the live electricity figure is the one people watch. Gas usage takes about 30 minutes to appear16, so the gas screen is better suited to judging a day's heating than to spotting the effect of turning a thermostat up.
The costs shown are estimates built from the tariff information the display holds18. They are a guide to spending rather than the figure on the bill, which comes from the meter readings themselves5. The frequency with which the meter sends readings to the supplier is a separate matter, covered in how often smart meters send readings.
Credit mode and prepay mode: two displays for two ways of paying
Smart meters can operate in credit or prepayment mode20, and the display changes with them. In credit mode, where the bill is paid at the end of each month or quarterly, it shows daily use and cost; in prepay mode it shows the available balance for each fuel and how close the household is to its next top-up2.
| Screen item | Credit mode | Prepay mode |
|---|---|---|
| Use in kWh and pounds and pence | Yes | Yes |
| Daily use and cost | Yes | Yes |
| Credit remaining | No | Yes |
| Emergency credit, and when it has been activated | No | Yes |
| Debt balance on the account | No | Yes, if there is one |
| Low-credit alert | No | Yes |
| Tariff price | Yes | Yes |
The prepay items are listed by Smart Energy GB3 and National Energy Action (NEA)21. Prepay displays give a low-credit alert when the balance falls below a set threshold and allow emergency credit to be entered22. Credit is usually shown as a balance in pounds and pence, and may also be available in the supplier's app or online account22.
For a prepay household, the display changes daily life more than it does for a credit customer. Ofgem notes that a smart meter in prepayment mode can add credit automatically or without a visit to a shop23; the display is where the household sees that credit arrive and fall. That removes one form of dependence, on a local shop or outlet being open, while leaving the household just as reliant on its supplier's systems to deliver the top-up. For more on this way of paying, see smart prepayment meters and how to check credit on a smart prepayment meter.
Budgets, alerts and 13 months of usage history
Both modes allow a budget to be set2. The display then shows how much has been spent each day, week or month against it24, and it can be set to alert the household if spending goes over the daily, weekly or monthly amount chosen18. Many models also allow alerts when spending is getting close to a limit or when there is a sudden increase in consumption2.
The history screens let a household look back. For direct debit or credit customers, the display holds historical consumption data for up to 13 months8, enough to compare a winter with the previous one. Which? lists the core functions as seeing historical energy use, setting a budget, showing meter readings and seeing tariff information25.
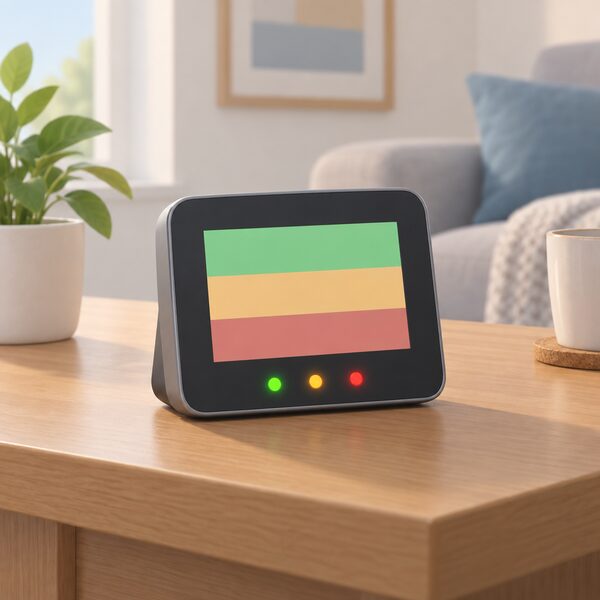
Many displays also carry a simple traffic-light style indicator. On the accessible in-home display, coloured LEDs indicate electricity usage26, giving an at-a-glance sense of whether demand is low or high without reading figures.
Whether these features change behaviour is a question of evidence as much as design. A 2023 Nesta report on social housing notes that recent evidence suggests in-home displays showing smart meter data could help householders make informed decisions about their energy use and budget effectively, and recommends that social landlords provide clear information on consumption and costs through in-home displays27. That is framed as "could help", not as a measured saving. Budget alerts only work if someone sets them and notices them; the display cannot switch anything off.
For independence, budgets and history matter because they turn a vague sense of "the bills are high" into specific times and loads. That knowledge is what a household needs before considering changes such as a time-of-use tariff or using energy data to size a solar or battery system. Thirteen months of totals on a small screen is a limited basis for that, which is where consumer access devices and the wider smart meter data rules come in.
The display pairs to your meter, and stays with the house
The smart meter sends data to the display over the Home Area Network, which Smart Energy GB describes as a secure network4. The installer pairs the display with the meter, so it only shows information from that particular meter14. Dual-fuel homes usually have both meters replaced in one visit and use a single display to view both gas and electricity28.
No wifi needed
The display does not use the home's broadband. Smart Energy GB states: "You don’t need wifi to use the in-home display either."29 For a household concerned about resilience, this is a real strength: the display keeps working when the internet is down, and it relies on no app or cloud account. More on this in do smart meters need wifi and how smart meters communicate.
Switching supplier or tariff
The display that came with a smart meter should still connect to it after a change of supplier or tariff30, and official guidance states that consumers can switch "without any disruption to your smart service"20. Each supplier may provide a different model3, so a new supplier does not mean a new display. Older first-generation meters have their own history on this point, covered in SMETS1 and switching supplier.
Moving house
The pairing is also why the display belongs to the property. Smart Energy GB's advice is to "Leave the display behind for the next resident", since it will not normally work in a different property8. Landlord guidance says the same of tenants: they should leave the display in the property because it is connected to that property's smart meter14. See monitoring in flats and rented homes.
Cost, running cost and the 12-month warranty
There is no separate charge for the display at installation. Smart Energy GB states that the costs are spread across everyone's bills, in the same way as the cost of running and maintaining traditional meters3. Running it costs less than £2 a year in electricity5, and NEA adds that displays have been designed to be as efficient as possible21. More on the charging question is in do you have to pay for an in-home display.
The warranty is the firmest rule on the page. The Energy Ombudsman sets it out:
"If you report a fault with the in-home display within 12 months of the date of installation, and your supplier is satisf"
In full, if a fault is reported within 12 months of installation and was not caused by the customer failing to keep the display in good working order, the supplier must repair or replace it free of charge31. After 12 months the supplier may apply a charge6, and Which? puts the cost of a new display in the region of £30 to £507.
| Stage | Position | Source |
|---|---|---|
| At installation | No separate charge; costs spread across all bills | 3 |
| Running cost | Less than £2 a year in electricity | 5 |
| Within 12 months | Supplier must repair or replace free, unless the fault is the customer's doing | 31 |
| After 12 months | Supplier may charge; about £30 to £50 for a new display | 7 |
| After 12 months, some suppliers | Voluntary help under replacement principles | 32 |
The dependence here is plain: after year one, a working display relies either on the household's own supplier having signed up to voluntary principles or on the household paying. For the wider picture of costs, see how much a smart meter costs and can I get a broken in-home display replaced.
Where an in-home display falls short: solar, appliances and billing
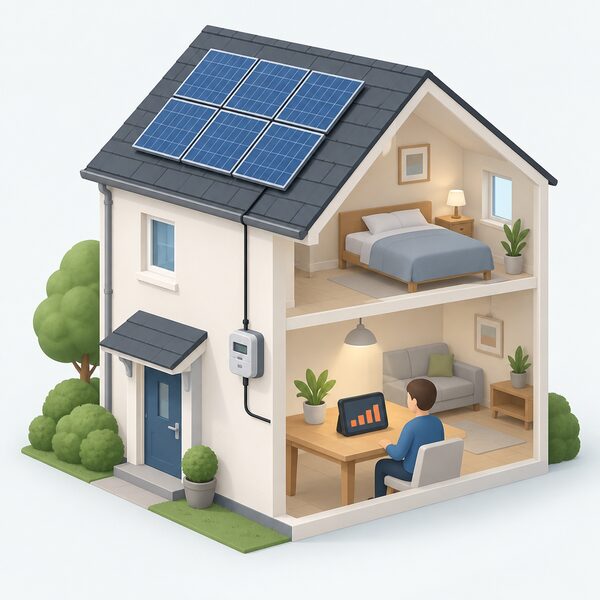
Solar generation is not shown
For a household generating its own power, this is the biggest gap. Smart Energy GB states that where a home has a smart meter and solar panels, the display will currently only show the energy being used and will not show how much the panels are generating6. It usually shows the energy bought from the supplier rather than everything generated28. Smart Energy GB says displays may in future be able to reflect self-generated energy8, but no date is given.
In practice, the display on a solar home is a measure of grid dependence: a low figure on a sunny afternoon means the panels are covering the load, but the screen does not say how much they produced or exported. Those figures come from the inverter or a separate system; see monitoring a solar and battery system, smart meters with solar panels and export metering.
Whole-home figures only
The display shows how much energy the home is using during the day23, as a single total. It does not break demand down by appliance. The live electricity figure can be watched while an appliance is switched on and off, but the display cannot record information4, so any per-appliance record has to be kept by hand or with other equipment such as smart plugs and appliance monitoring or a standalone energy monitor. See also working out what an appliance costs to run.
Not a basis for billing
The display is for information only5. Its costs are estimates18, and what happens on the display does not affect the readings supplied to the energy company12. A disagreement over a bill is settled on the meter readings, not the screen. See do smart meters give more accurate bills and smart meter standards and accuracy.
Accessible versions are not offered everywhere
Accessible in-home displays have been designed for people who might benefit from "a larger display, easier to use buttons and audio options"33, including people with sight loss, dexterity issues or memory loss34. Features may include audio functions, larger text, high-contrast screens and spoken energy information8; the accessible model has a large typeface and a TFT screen with a high-contrast colour scheme optimised for visual impairment and colour blindness26. They are offered at no extra cost to selected customers but are not yet available with every supplier26, and eligibility may vary35.
When the screen goes blank or loses data: fixes and replacement
Most display problems have a small number of published causes. Smart Energy GB's troubleshooting guidance sets out these steps12:
- Blank screen. The battery may have run out. Plug the display in, let it charge for a few moments, then turn it back on.
- No data, or a lost signal. Turn the display off, move it closer to where the electricity meter is, and turn it back on. This should restore connectivity and the display should begin showing data again within 24 hours.
- Electricity showing but no gas. Press the on/off switch and unplug the charger, then hold the on/off switch down for a few seconds while plugging the charger back in. The display should reconnect to both meters after a few minutes.
- Figures behind the meter. Readings on the display can take longer to update than those on the meters, and this is described as normal.
A display that has been off for some time may take up to 24 hours to reconnect and show updated information8. Gas figures arriving only every half hour19 is also normal behaviour, not a fault. More detail is in in-home display shows electricity but no gas and smart meter faults and troubleshooting.
Finding the right manual
Menus, buttons and settings differ between makes. Citizens Advice keeps a list of user guides that can be searched by manufacturer or by the number of buttons on the display, not counting power or reset buttons10. Smart Energy GB also publishes instructional videos for common models17. Pages on specific makes include Chameleon in-home displays, GEO and Secure Meters.
Getting a replacement
If a display cannot be fixed, the supplier is the route to a new one. A replacement should not involve replacing the meters; the new display is paired with the existing smart meter9. If the supplier gave the display less than a year ago, it should be able to help and can often repair or replace it12. Citizens Advice also sets out steps for fixing display problems and escalating them1.
Old displays are not simply thrown away. Which? notes they are covered by the Waste Electrical and Electronic Equipment (WEEE) recycling regulations, under which energy suppliers should collect, recondition and reuse them as much as they can7.
What the display does for a household's independence
The display gives a household something it did not have with an old meter: a live, local view of its own demand that needs no internet, no app and no subscription29. That makes it a modest but genuine tool for self-reliance, particularly in prepay homes where the credit balance and emergency credit are visible at a glance3.
The dependence that remains is equally clear. The display is paired to one meter and one property14, it shows grid imports rather than solar generation6, its costs are estimates rather than the bill5, and after 12 months its repair rests on the supplier or the household's own purse6. For a fuller view of data and control, see in-home display vs smart meter app, home energy management systems, smart meters and energy independence and the full smart meters and home energy management guide.
Sources35 cited
- Fixing problems with your smart meter's in-home display, Citizens Advice
- How do smart meters save energy?, Smart DCC
- What is a smart meter?, Smart Energy GB, 2026-08-10
- Data access and privacy, Smart Energy GB, 2026-03-16
- Switching supplier, tariffs and bills FAQs, Smart Energy GB, 2026-03-16
- Myth-busting smart meter problems, Smart Energy GB, 2026-09-17
- Smart meter problems and solutions, Which?, 2026-08-24
- Smart meter FAQs, Smart Energy GB, 2025-08-08
- Do I already have a smart meter?, Smart Energy GB, 2026-03-16
- Find the user guide for your smart meter's in-home display, Citizens Advice, 2026-09-17
- Getting a smart meter installed, Smart Energy GB, 2026-03-16
- Troubleshooting smart meter issues, Smart Energy GB, 2026-04-01
- Cooling-off background paper, Ofgem, 2014-02-20
- Smart meters for landlords, Smart Energy GB, 2026-03-16
- Does a smart meter need wi-fi?, Smart DCC
- How to use a smart meter to save money, Smart Energy GB, 2026-04-24
- In-home display instructional videos, Smart Energy GB, 2026-03-16
- Smart meter benefits for you, Smart Energy GB, 2026-08-18
- Guide to smart meters, Energy Saving Trust, 2026-07-15
- Smart meters: your rights and expectations, GOV.UK, 2025-08-08
- Understanding smart meters, National Energy Action, 2026-04-21
- Using a smart meter in prepay mode to save money, Smart Energy GB, 2026-08-17
- Get help with your smart meter, Ofgem, 2026-09-17
- Smart meters, Energy Systems Catapult, 2025-08-19
- How to use your smart meter data, Which?, 2026-07-14
- The accessible in-home display, Smart Energy GB, 2026-03-16
- Recommendations for social housing providers, Nesta, 2023-08-30
- How do smart meters work?, Smart Energy GB, 2026-08-27
- Does a smart meter need wifi?, Smart Energy GB, 2026-03-16
- Switching supplier with a smart meter, Smart Energy GB, 2026-03-16
- Smart meters, Energy Ombudsman
- Frequently asked questions about smart meters, National Energy Action, 2024-05-03
- Understanding smart meters leaflet, National Energy Action, 2026-06-12
- How carers could prepare for higher energy bills, Smart Energy GB, 2026-03-16
- Smart meters and carers, Smart Energy GB, 2026-08-19
 How a Smart Meter WorksHow a British smart meter measures gas and electricity, how the in-home display and the DCC's secure network fit together, what data leaves the house, what it costs, and where smart mode goes wrong.
 The Full Smart Meters GuideDo smart meters really save you money, and how do you use one to cut your bills?
 Smart Meter Faults and FixesYour smart meter has stopped working.
 HEMS and Monitoring CostsWhat does a home energy monitor cost to buy and run?
 Take Control of Your EnergyHow do you read your own energy use and keep hold of your meter readings?
 Who Owns Your Home Energy DataYour smart meter records how much gas and electricity you use, and that information belongs to you, not your supplier.