
In this guide
A baseline is simply the record of how much gas and electricity a home actually used over a settled period, in kilowatt hours, before anything is changed. It comes from three places: past bills, meter readings taken by hand, and, where one is fitted, the data a smart meter records and sends. Without it, every later claim about savings is guesswork, and every quote for a heat pump, a battery or a solar array rests on an assumption rather than a measurement.
For comparison, the medium consumption values used in setting bill values are 2,700 kWh a year for electricity and 11,500 kWh a year for gas, with 3,900 kWh for multi-register meters1. Those are reference points, not targets: a home well above them is not necessarily wasteful, and a home below them is not necessarily efficient. What matters is the shape of a household's own use, because more than 80 per cent of home energy use goes on heating and hot water2, with around 11% of energy use going to heating water specifically3. Domestic energy costs form 6% of total household expenditure on average, but 10% for the lowest income decile4.
A smart meter with an in-home display is the fastest route to that picture, and in England, Scotland and Wales it is installed free of charge5. But it measures only what crosses the meter. It will not show what solar panels generate, it will not tell a household which appliance is responsible for a spike, and it will not save money by existing: a meta-analysis used in official impact assessment modelled an average household saving of 3.45% on electricity consumption and 3% on gas6.
Why a measured starting point comes before any spending
Heating makes up the biggest share of energy use in most homes, which is why cutting heat loss is one of the simplest ways to reduce it10. More than half the energy spend for a typical home can be attributed to heating rooms and hot water11. A baseline tells a household whether its own split matches that pattern or departs from it, and the departure is usually where the money is.
Seasonality is the reason a single month is never enough. July to September is a period when homes use only around 20% of the energy needed for the rest of the year12. A baseline taken over a summer quarter will understate annual demand badly and will size a heating system wrongly. A full year of bills, or at least a year of meter data, is what carries the comparison through a heating season.
The baseline also has a second life after the work is done. It is the only thing a post-installation figure can be measured against, which is why it belongs alongside measuring results after the work and a whole house plan. Improving the energy performance of homes is described as vital to cut bills, improve comfort and reduce carbon emissions13; knowing the starting figure is what turns that from an aspiration into an arithmetic.
There is appetite for it. In a Northern Ireland survey, 62% of respondents agreed they were concerned about how much energy is used in their home14. Concern is not the same as measurement, and the gap between the two is what a baseline closes.
What a smart meter measures and what it sends
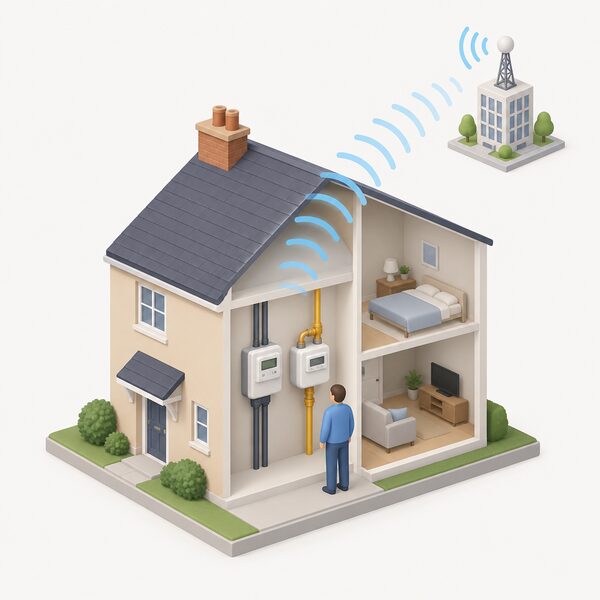
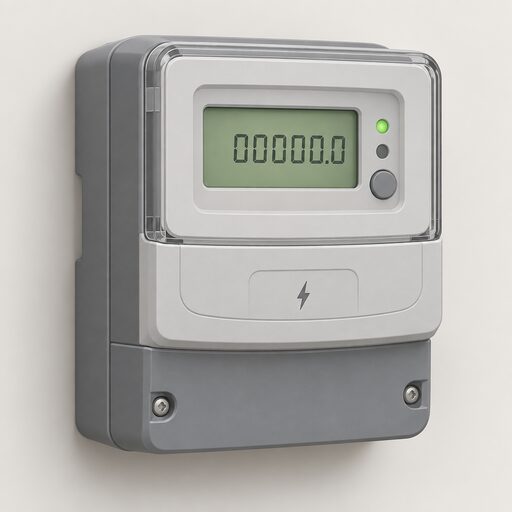
A smart meter measures how much gas and electricity a home is using and sends those readings automatically to the energy supplier over a secure network5. It measures consumption at the meter point for the whole property. It does not break that total down by room, by circuit or by appliance.
Readings travel over a dedicated network. A smart meter does not need, and does not connect to, the public internet or home Wi-Fi15, and it does not use a household router or affect broadband speed16. That matters for rural homes and for households with no broadband at all: metering works without it.
The data itself has defined uses. It is used to bill for the energy used, to offer new products and services such as new tariffs where permission has been given, and to help make the energy system more efficient by recording demand more accurately17. The practical consequence for a household is bills based on accurate readings rather than estimates18, which is what makes historic consumption trustworthy enough to baseline against.
| What it does | Detail |
|---|---|
| Measures | Gas and electricity use for the whole property5 |
| Sends to supplier | Automatically, over a secure smart meter network9 |
| Minimum frequency | Monthly, with daily or half-hourly optional9 |
| Needs Wi-Fi | No15 |
| Cost to household | Free from the supplier19 |
How often readings go to the supplier
Monthly is the floor; daily and half-hourly are options a household can choose9. A smart meter sends readings on a half-hourly, daily or in some cases monthly basis20, and automatic readings can provide monthly, weekly, daily or even half-hourly data21. Half-hourly sending is what unlocks access to more flexible tariffs, including dual-rate tariffs17, and it is also what produces a usable load profile for anyone considering a battery. The independence trade is plain: finer data buys better decisions and better tariff access, and it also means the supplier holds a more detailed record of household activity.
The in-home display: pounds, pence and kilowatt hours
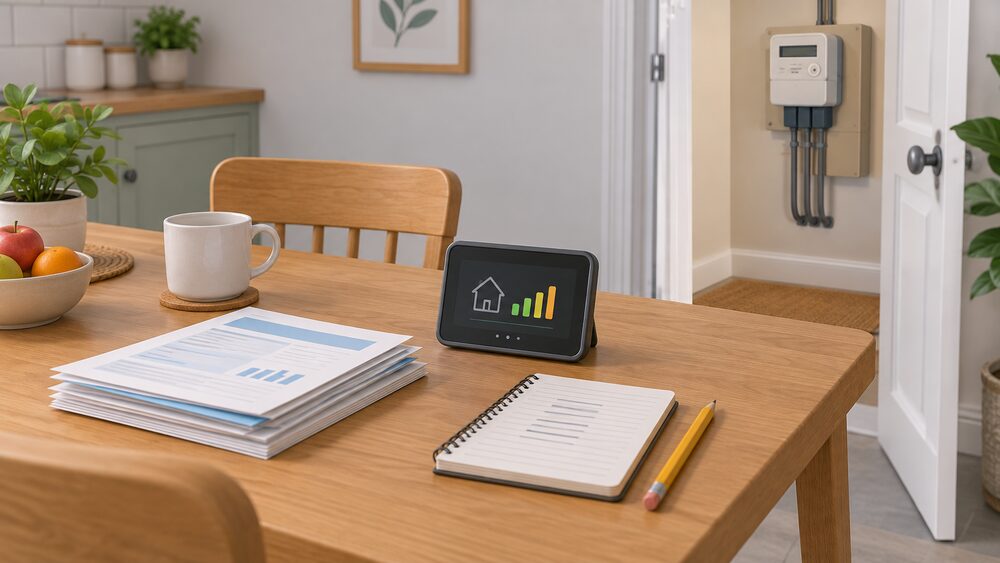
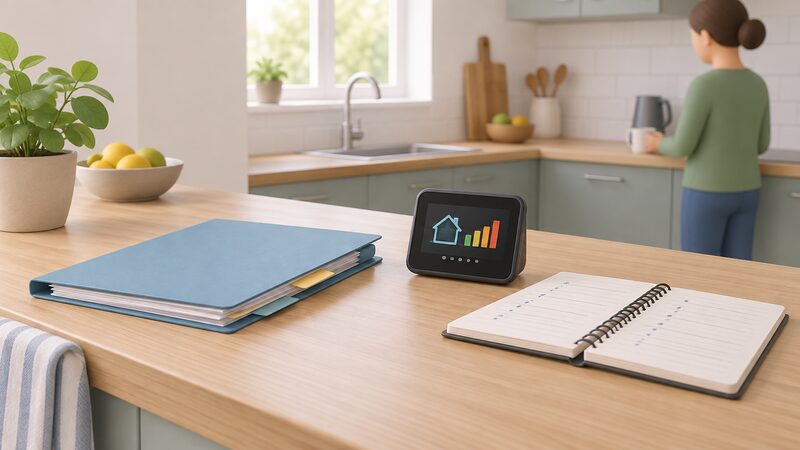
Every smart meter installation comes with an in-home display provided15. It is a small portable device that tells a household in pounds and pence how much energy is being used22, and it can be switched to show energy usage in kWh instead of cost23. For baselining, the kWh view is the one that stays comparable when unit rates move.
The display shows how much energy was used in the last hour, week and month, and what it cost9. Daily, weekly and monthly totals are the standard views7. Those totals are the ones worth writing down: a weekly kWh figure through winter and another through summer gives a household two anchors rather than one.
One limit is worth stating firmly. The display is for information only; regular energy bills still arrive in the same way, accurate without manual readings24. Nothing on the display is the bill, and a discrepancy between display and bill is not in itself an error.
"You don't have to have one, but it's the easiest way to see what energy you're using and what it's costing you"
Near real-time: 10 seconds for electricity, half an hour for gas
Electricity usage on the display updates every 10 seconds, and gas usage every half an hour8. Those two intervals explain most of what people take for faults. Switching on a kettle moves the electricity figure within seconds; firing the boiler moves nothing on the gas side for up to half an hour26.
The 10 second electricity refresh is what makes appliance hunting possible at all. Turning one thing on at a time and watching the change is a crude but genuine measurement, and it is the only appliance-level data a smart meter offers without extra equipment.
Supplier apps and online accounts add graphs, some showing use in each half hour, but often at a day's delay27. For a baseline that is fine; for diagnosing a spike as it happens, the display is the faster instrument.
Reading the display in credit and prepay modes
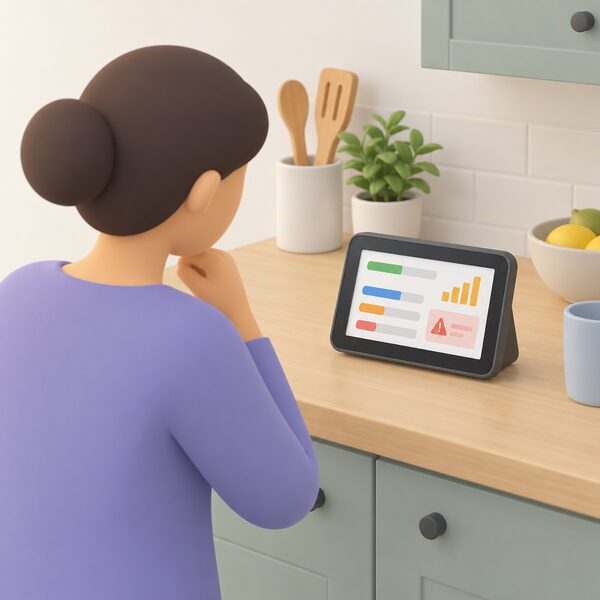
The display has two modes depending on how a household pays28. In credit mode, where the bill is paid monthly or quarterly, it shows daily use and cost. In prepay mode, it shows the available balance for each fuel and how close the household is to the next top-up28.
For prepay households the display carries more weight, because it replaces a trip to the meter. It shows the tariff price, the credit balance, any debt on the account, and alerts when credit is low7. The fuller list runs to remaining balance, emergency credit, any outstanding debt, current energy costs, electricity and gas usage, and historical consumption data29. The display will show when a household is nearly out of credit30.
| Mode | What the display shows |
|---|---|
| Credit | Daily use and cost28; use and cost by day, week and month7 |
| Prepay | Credit remaining, emergency credit and when activated, debt balance, low credit warning9 |
Historical consumption is the part that serves a baseline in both modes. For a prepay household, top-up records are also a consumption record, and reading them alongside display history gives the same annual picture a credit customer takes from bills.
Setting budgets and alerts to find where energy goes
Both modes allow budgets to be set28. Many models also allow alerts that warn when a household is getting close to its limits, or when there are sudden increases in consumption and spending28. A sudden-increase alert is the closest thing an in-home display offers to a diagnostic: it flags the moment, and the household supplies the explanation.
Budgets are best set from the baseline rather than the other way round. A weekly kWh figure taken from a settled period gives a realistic limit; a figure plucked from an average household will simply alarm constantly in a large or poorly insulated home.
Third-party displays and apps go further. Ivie shows where a household is using the most energy and gives personalised advice on using less, and rewards points and potential prizes for reducing usage27. Free estimating tools also exist: Home Energy Scotland's home energy check is a free tool that estimates how much energy a home may be using and suggests changes that could reduce bills31, and the Northern Ireland Housing Executive offers a home energy saving tool to help understand how efficient a home is and what changes could reduce energy use32. Which?'s home energy planning service bases estimated costs and savings on property type, size, age and location, plus assumptions about the number of occupants and energy usage, using Energy Saving Trust data33. All of these are modelled estimates, not measurements, and where a real meter reading exists it should outrank them.
What the display does not show, including solar generation

This is the sharpest limit for anyone pursuing independence. An in-home display will usually show the energy being bought from the supplier rather than everything the home generates16, and for a household that already has solar panels the display will currently only show the energy being used, not how much the panels are producing26. Smart Energy GB states that the display may in future be able to reflect self-generated energy such as solar29. The communications hub transmits data to the display showing how much energy is being used or sold back to the grid34.
The practical effect is that a solar household reading only its in-home display will see imports fall and may wrongly conclude its consumption has fallen. Generation needs its own monitoring, usually from the inverter. Anyone planning panels should read the display as a measure of dependence on the grid, not of total household demand, and pair it with solar, battery or heat pump sequencing.
The other absences are structural. The display shows no circuit-level or room-level breakdown, no distinction between a heat pump and an oven, and no generation. For a baseline that is adequate, because a baseline is a whole-home total. For fault-finding, it is not.
Appliance-level costs: what a kettle really uses
Whole-home totals conceal the behaviour that produces them, and a few well-documented figures make the point. Boiling more water than needed for one cup costs around £10 a year in Great Britain and around £12 a year in Northern Ireland36. That difference is a straightforward consequence of different unit rates, and it is a useful reminder that identical behaviour costs differently across the UK.
An example set of appliances covering a kettle, television, air fryer, laptop, games console, electric oven, electric shower, LED lighting and an energy panel heater was costed at £37 per month based on the price cap in force3. Set beside 2,700 kWh a year of electricity at the medium consumption value1, the scale of everyday appliance use against heating becomes clear.
A display can be used to establish these figures directly rather than taking them on trust. With everything else off, switching one appliance on and watching the electricity figure move within seconds gives a household its own numbers, at its own tariff, in its own home. Pages on which appliances use most electricity, air fryer versus oven and standby savings cover the individual cases.
What appliance costs cannot do is substitute for the heating baseline. With more than 80 per cent of home energy going on heating and hot water2, an appliance audit addresses the minority of the total even when it is done perfectly.
Getting a smart meter: cost, eligibility and how to apply
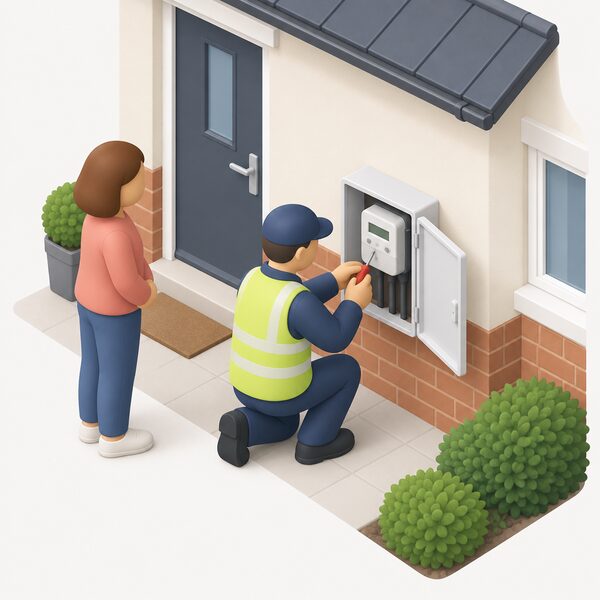
There is no charge. A smart meter is available free from the supplier19, and installation in Wales typically takes about 90 minutes and is free of charge5. The route is the same everywhere in Great Britain: contact the supplier.
Eligibility is broader than many assume:
- Any household that pays for energy, whether owning or renting, should be able to book an installation where a smart meter is expected to work in the property37.
- Private renters can choose one if the energy bills are in their name or they prepay, after checking the tenancy agreement and letting the landlord know38.
- Applications are open to renters, prepay customers, and homes where the meter is located outside the property, such as flats with communal meter boxes21.
Installers are expected to provide energy efficiency advice at the visit25. That advice is general and is not a substitute for a home energy assessment or an EPC.
Refusal is equally a right. Installation is not compulsory and an offer can be declined39, and a household does not have to accept a smart meter40. The practical qualification matters: while refusal is a right, if a traditional meter needs replacing because it is faulty or unsafe, options may be limited38, and most energy companies no longer stock traditional meters41. Renting households will find more on their position in where to start if you rent.
When readings stop or the display loses signal
Smart meters do fail. A meter may stop recording the energy used, or may no longer send readings to the supplier17. The consequences are contained but real: bills may temporarily become estimated, manual readings may be needed, and the in-home display may stop updating correctly42.
Power cuts are a separate case. An electricity smart meter may stop displaying information during a power cut, but the supplier will still retain previous readings42. Data already sent is not lost with the lights.
Switching supplier is the other common trigger. Where a supplier goes out of business, a meter may not work in smart mode with the new supplier, and manual readings may need to be taken and submitted instead; it may work in smart mode again after a change of tariff or supplier43. Households in that position are back to the position of any home without a smart meter, which still needs manual readings submitted to avoid an estimated bill44.
For a baseline, an interruption is an annoyance rather than a disaster provided the meter itself keeps recording: the totals on the meter face still advance. What is lost is the granular half-hourly history, and that is the part that cannot be reconstructed afterwards. Keeping a written note of quarterly meter readings, filed with the rest of the paperwork to keep, is the low-technology insurance against it.
What a baseline does, and does not do, for independence
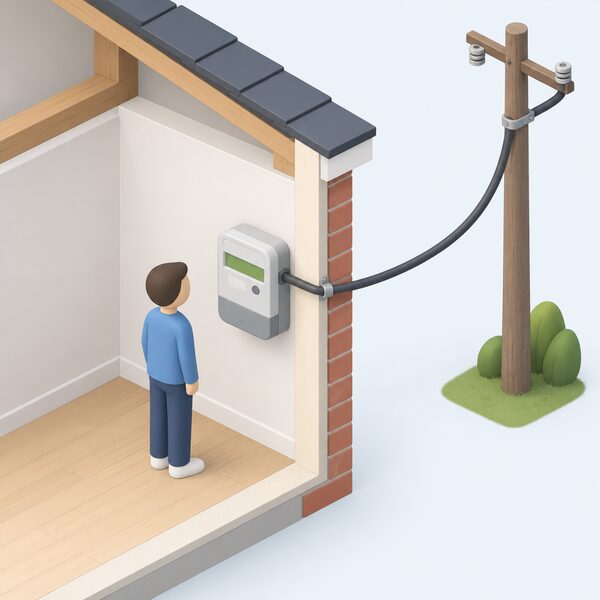
A smart meter measures the boundary between a home and the grid. That makes it an excellent record of dependence and a poor record of self-supply. The data puts a household in control of its usage, so that energy-saving steps can be taken to reduce emissions45, but the tariff is not in the household's hands: except by switching, a household does not control the tariff its supplier sets, though it can change how much energy it uses28.
The measured effect of metering alone is modest by design: 3.45% on electricity and 3% on gas for an average household in modelled terms6. A smart meter will not automatically save money40. It is an instrument, and the value comes from what the household does with the reading.
The dependencies that remain are worth naming. The meter is installed and owned through the supplier, the data path runs over a national network rather than equipment the household controls, the display is guaranteed for a year and no longer35, and the display shows imports rather than generation16. A baseline built on it is still the most useful single number a household can hold before specifying insulation, heating or generation, and it is what turns order of energy improvements from a general rule into a decision about one particular house. Fuller context on sequencing sits on the getting started guide.
Sources45 cited
- Summary of changes to the energy price cap, 1 October to 31 December 2025, Ofgem, 27 August 2025
- Insulation, nidirect, 2 September 2026
- Water efficient shower heads, Smart Energy GB, 22 April 2026
- Electricity prices in Great Britain, House of Lords Library, June 2026
- Smart meters, Welsh Government, 2026
- Smart meter Guaranteed Standards of Performance draft impact assessment, Ofgem, August 2025
- Understanding smart meters, National Energy Action, 21 April 2026
- Data access and privacy, Smart Energy GB, 16 March 2026
- What is a smart meter, Smart Energy GB, 10 August 2026
- Wrap your home in insulation, Low Carbon Hub, 27 November 2025
- Boilers, Home Energy Scotland, 20 September 2026
- Any drop in energy bills is welcome, National Energy Action, 1 July 2024
- Citizens Advice response to consultation on energy reforms, Citizens Advice, 26 February 2025
- Attitudes to the Energy Transition, Consumer Council for Northern Ireland, December 2023
- Does a smart meter need Wi-Fi?, Smart DCC, 2026
- How do smart meters work?, Smart Energy GB, 27 August 2026
- Get help with your smart meter, Ofgem, 17 September 2026
- Getting a smart meter, Ofgem, 2026
- Getting a smart meter, Ofgem, 2026
- How to use a smart meter to save money, Smart Energy GB, 24 April 2026
- How to get a smart meter, Smart DCC, 2026
- Our view on smart meters, National Energy Action, 12 June 2026
- What appliances use more electricity, Smart Energy GB, 16 March 2026
- Switching supplier, tariffs and bills, Smart Energy GB, 16 March 2026
- Getting a smart meter installed, Smart Energy GB, 16 March 2026
- Myth busting smart meter problems, Smart Energy GB, 17 September 2026
- How to use your smart meter data, Which?, 14 July 2026
- How do smart meters save energy?, Smart DCC, 2026
- Smart meter FAQs, Smart Energy GB, 8 August 2025
- Benefits for you, Smart Energy GB, 18 August 2026
- Support for people in rural homes, Home Energy Scotland, September 2026
- Energy, Northern Ireland Housing Executive, 17 September 2026
- Home energy planning service, Which?, 18 June 2026
- How do smart meters send readings?, Smart DCC, 2026
- Public Accounts Committee report on the smart meter rollout, UK Parliament, 20 October 2023
- Energy mistakes to avoid, Energy Saving Trust, 15 October 2025
- Smart meters: your rights and expectations, GOV.UK, 8 August 2025
- Smart meters, Energy Ombudsman, 20 September 2026
- Guide to smart meters, Energy Saving Trust, 15 July 2026
- Getting a smart meter installed, Citizens Advice, 17 September 2026
- Smart meter installation, Which?, 26 February 2026
- How can I read a smart meter, Smart Energy GB, 17 August 2026
- What happens if your energy supplier goes out of business, Ofgem, 2026
- Smart meters vs home energy monitors, Smart Energy GB, 17 August 2026
- Smart meters and decarbonisation, Smart DCC, 2026
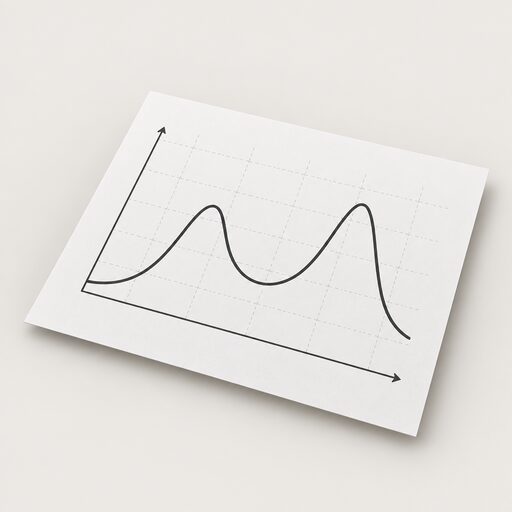 Sizing a System With DataWhat does your smart meter data actually show about how your home uses power?
 Self-ConsumptionHow much of the electricity from your own solar panels do you actually use, and how much goes to the grid?
 The Full Statistics GuideHow many homes in the UK have solar panels, heat pumps or batteries?
 Take Control of Your EnergyHow do you read your own energy use and keep hold of your meter readings?
 Reducing Your BillRanks household electricity and gas uses by share of the bill and sets out what each measure changes, from heating settings and insulation to appliance use and tariff choice.
 Behind-the-Meter SystemsWhere does your meter sit, and what does that mean for the solar panels or battery you put in at home?