
In this guide
Measuring savings after energy work means comparing like with like. Three different things get called "savings": how much energy the home uses, what that energy costs, and what the EPC says about the building. They move at different speeds and can disagree. A home can use less gas and still show a similar bill if the unit price has risen, and a home can gain a better rating without the household noticing any change in comfort.
The instrument for the first two is the meter. A smart meter records energy use in half-hour periods and sends readings to the supplier automatically, so bills are built on actual rather than estimated usage1. The in-home display shows how much energy is being used during the day, which is what makes a before-and-after comparison possible without waiting for a quarterly bill2.
The third measure, the rating, comes from an Energy Performance Certificate. Domestic EPCs are produced using standard information about buildings, which is what allows one home to be compared with another, and the assessment records dwelling type, floor area, construction type, insulation, heating, ventilation and lighting3. That standardisation is the strength and the limitation: it makes ratings comparable, and it means the rating is a model rather than a measurement of your household.
Usage, cost and rating are three different measures
The distinction matters because each answers a different question, and a household that expects one to move will be disappointed when another does.
Usage is the physical quantity: kilowatt hours of gas and electricity. It is what a meter measures and what a retrofit changes. Cost is usage multiplied by a tariff, and the tariff is not under the household's control. The Smart Energy GB network operator states the position plainly: "Except by switching, you don't control the tariff your energy supplier sets, but you can change how much energy you use."9 A price rise can therefore cancel a genuine reduction in usage, and a household reading only the bill will conclude, wrongly, that the work did nothing.
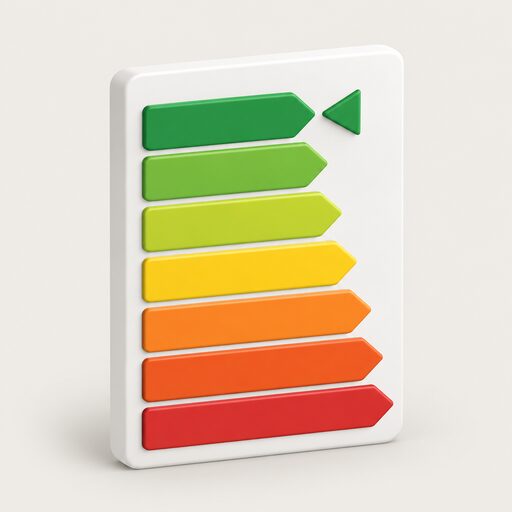
Rating is a modelled figure. The Energy Efficiency Rating on a domestic EPC is derived from estimated regulated energy use per unit floor area, and a separate cost-based rating is based on the modelled cost to run the dwelling, normalised to floor area10. Both are estimates produced to a standard method, not readings from your home.
For deciding whether a measure was worth doing, official guidance uses a payback calculation: the cost of implementing the measure, not the whole project, divided by the annual energy saving achieved by that measure12. That is an economic test applied to a single measure, and it depends on an annual saving figure that has to come from somewhere. The rest of this page is about where that figure comes from and how much confidence it deserves.
"Retrofitting means making changes to existing buildings to reduce energy use and therefore carbon emissions."
Establish a baseline before the work starts
A baseline is a record of consumption and condition taken before anything is changed. Without one, there is nothing to compare against, and the comparison becomes a memory of what the bills used to be.
The EPC is the natural starting document. Each EPC comes with a report setting out cost effective measures to improve energy efficiency and the energy rating, such as low energy bulbs or upgrading insulation3. That report is a checklist, and the rating it produces is a fixed point recorded at a known date. The assessment behind it records the dwelling type, floor area, construction type, insulation, heating, ventilation and lighting, so the baseline describes the building as well as the consumption4.
Consumption data comes from the meter. Where a smart meter is fitted, energy use is recorded automatically in half-hour periods, which gives a far finer baseline than a quarterly bill1. Where it is not, monthly manual readings taken on the same date each month serve the same purpose at lower resolution.
There is a national dataset that shows why this matters. Analysis of domestic energy consumption by EPC rating found that more energy efficient houses tend to have lower gas consumption, even after adjusting for floor area14. That is a relationship across many homes, not a prediction for one, but it confirms the direction of travel that a baseline is meant to capture.
For a new dwelling, official guidance requires the calculation to be done twice: before work starts using design values, and again when work is complete using figures for the building as constructed15. That two-stage approach is the model worth copying in an existing home, even though no regulation requires it there.

Smart meters and the in-home display as your measuring instrument
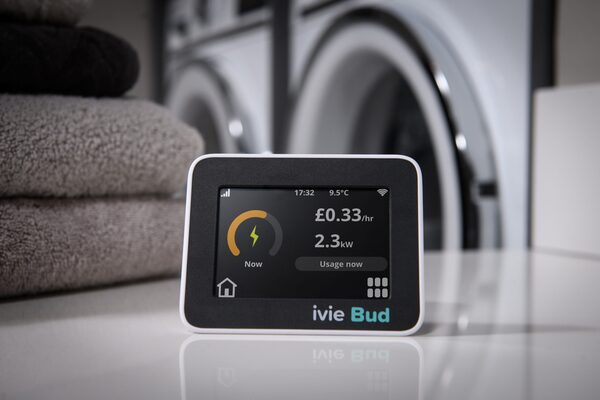
A smart meter measures gas and electricity usage and sends the data directly to the energy supplier2. Readings go automatically via the secure network to the supplier, so no manual submission is needed9. The practical effect for measurement is that the consumption record exists continuously and at half-hourly resolution, whether or not anyone writes anything down.
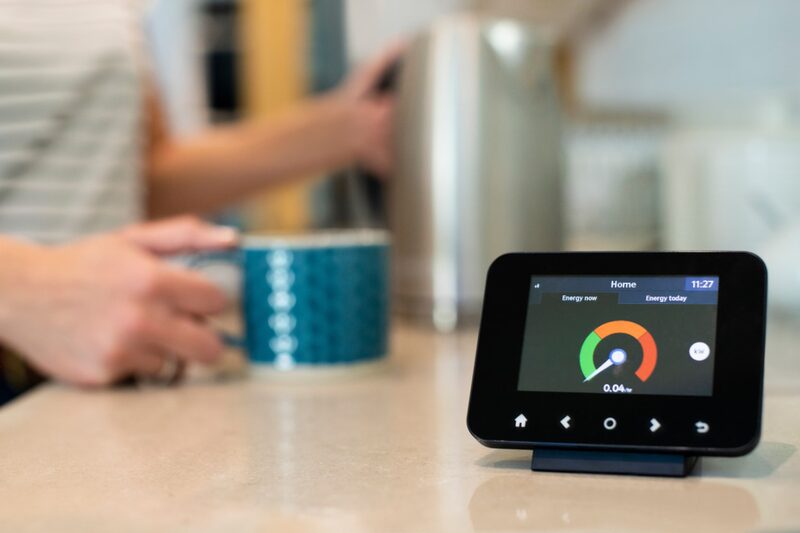
The in-home display is the part that makes the data visible in the moment. Smart meters come with an in-home display, a portable touchscreen device that shows near real-time energy usage data16. Ofgem describes the same device as showing how much energy is being used during the day, and as allowing a household to monitor usage and spending17.
That near real-time view is what turns a retrofit into something observable. A heating control change, a cylinder thermostat adjustment or a draught-proofing measure shows up on the display within a day, long before a bill arrives. The network operator's own framing is that the data puts households in control of their energy usage, so that energy-saving steps can be taken16.
Two limits are worth stating. First, the display shows usage, not attribution: it cannot tell a household how much of a change came from the insulation and how much from a milder week. Second, the display is a convenience device, not the billing record. The meter is the billing record.
What the in-home display shows, and what it does not
The display shows how much energy is being used during the day, and it allows monitoring of usage and spending17. In practice that means a household can see the effect of switching the heating off an hour earlier, or of running the washing machine at a different time, on the same day.
What it does not show is a weather-corrected comparison, a breakdown by end use, or a figure for what the home would have used without the work. It also does not show cost with any precision beyond the tariff information loaded into it, and the tariff itself is set by the supplier9. A display reading is evidence of what happened in a half-hour period, not a measurement of a retrofit's effect.
The distinction between the display and the meter matters when something goes wrong. Where a smart meter is not operating in smart mode, Ofgem states that manual readings can still be taken20. The reading is taken from the meter, and the display is not a substitute for it.
Reading bills: actual readings rather than estimates
A bill built on estimates cannot measure anything, because it is not a record of consumption. The point of a smart meter in billing terms is that it produces bills based on accurate meter readings and not estimates, so a household pays for the energy actually used rather than the approximate cost of an estimated bill19.
Ofgem monitors this. Its proposed consumer outcomes include testing regular energy bills to ensure actual meter readings match real consumption and that charges are applied correctly, with statistical sampling possible, and estimated meter reads are not classed as accurate if they differ from actual consumption21. That is a regulatory check on the billing chain, and it exists because estimated reads are a known source of error.
Where a bill is still estimated despite a smart meter being fitted, the cause is usually communications or configuration rather than the meter. Ofgem directs households with smart meter problems to its help pages and to the supplier17. A supplier can confirm whether the meter is operating in smart mode.
Supplier failure is the other case where readings matter. Ofgem advises taking a meter reading as soon as possible and keeping a record of it, so that the new supplier bills correctly22. The same discipline applies after a retrofit: a reading taken on the day the work finishes, kept with the paperwork, is the anchor for everything that follows.
Weather, occupancy and comfort taking
A reduction in measured consumption is not the same as a reduction in measured saving, because households respond to warmer homes. This is the single most common reason a bill does not fall as much as expected.
The evidence base for measure-level savings is the National Energy Efficiency Data-Framework, which publishes impact of measures analysis assessing the effect of installing home efficiency measures such as loft insulation on household energy consumption23. That analysis exists precisely because the raw before-and-after comparison is confounded by weather, occupancy and behaviour.
Weather is the largest confounder. A heating season that is milder than the previous one reduces gas consumption with no work having been done at all, and a colder one can mask a real improvement. This is why a like-for-like comparison needs either a full heating season on each side or a degree-day correction, and why a summer-to-winter comparison is meaningless.
Occupancy changes independently of the building: a household member working from home, a new baby, a lodger, or a change in the number of people living in the property all move consumption. The Optimised Retrofit Programme in Wales found, in pre-survey responses about retrofit decisions, that although respondents mentioned climate change, energy and cost saving were generally the priority24. Households retrofit to be warmer and cheaper, and a warmer home uses some of the saving.
Comfort taking is the name for that effect. A household that was underheating before the work may heat more of the home, or to a higher temperature, after it, so the meter shows less reduction than the theoretical saving. The saving is real, but it appears as comfort rather than as a lower bill.
EPC recommendations as a checklist, and how measures accumulate
The recommendation report attached to an EPC is a list of cost effective measures, and it is ordered. Each EPC comes with a report setting out cost effective measures to improve energy efficiency and the energy rating, such as low energy bulbs or upgrading insulation3.
Scotland has moved further on what a report contains. A new Property Report will set out potential improvement measures that could improve the energy efficiency and lower costs, ranked by lowest installation cost and greatest heat saved, plus alternative heating systems with potential installation and running costs26. That ranking is directly useful for measurement, because it tells a household which measures are expected to deliver the most heat saved per pound.
The reason order matters is that measures interact. Fabric work reduces the heat demand that a heating system has to meet, so a heating upgrade after insulation performs differently from the same upgrade before it. A council programme in Edinburgh set a target that the energy retrofit interventions would allow each home, bar a few exceptions, to meet a minimum energy performance rating of EPC B or SAP 817. That is a whole-property target reached by a sequence of measures, not by any single one.
Scotland's domestic EPC reform proposes a different presentation of the same idea: a Heat Retention Rating reflecting fabric energy efficiency, a Heating System Rating covering type, emissions and efficiency, and an Energy Cost Rating26. Splitting the rating into parts makes it possible to see which part of the work moved, which a single headline number conceals.
The Committee on Climate Change has advised that domestic EPCs should include four primary metrics using real-world units and clear simple names: Energy, as total energy use intensity in kWh/m2/yr; Fabric, as space heating demand intensity in kWh/m2/yr; Heating, as heating system type ranked from 1 to 6; and Cost, as energy cost intensity in £/m2/yr27. Under that structure, a household could see a fabric improvement and a cost change separately.
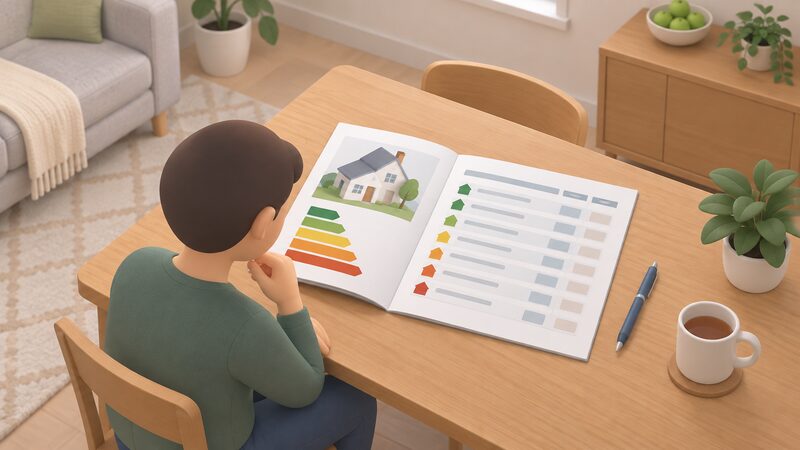
Where EPC estimates fall short
The EPC is a model, and its limits are documented by the bodies that produce and use it.
The rating is derived from estimated regulated energy use per unit floor area, and the cost figure is an estimate of annual expenditure on regulated energy, excluding plug-in appliances10. Appliances are outside the model, so a household that changes its cooking, laundry or refrigeration has changed its consumption without changing its rating.
The Committee on Climate Change's assessment is blunt: the ratings on EPCs are an important policy tool used to define standards and targets for reducing emissions from homes, but they are poorly suited to that purpose27. That is a criticism of the metric, not of the assessment, and it explains why reform is under way in Scotland and consulted on in England.
There is also a fuel cost assumption embedded in any cost-based rating, and fuel prices move independently of buildings. A rating calculated on one set of prices will not track a household's actual bill through a price change.
For measurement, the practical conclusion is that the EPC is a good baseline and a poor progress meter. It records the building at a date, in a standard form, and it can be repeated after the work to show what the model now says. It cannot tell a household what it saved.
A worked example: loft insulation to 270 mm
Loft insulation is the clearest case for a before-and-after comparison, because the measure is simple, the target is defined, and the effect is concentrated in the heating season.
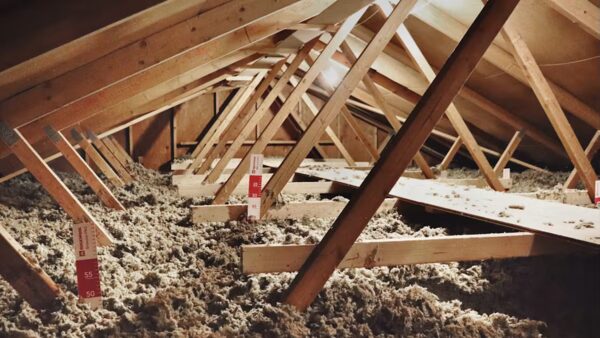
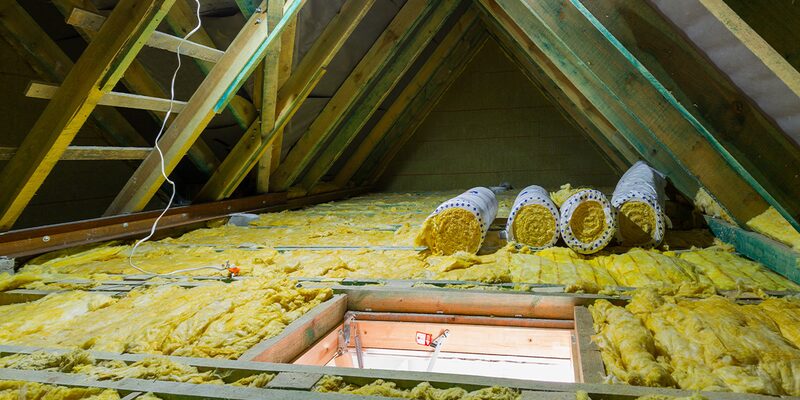
Northern Ireland's official guidance gives the target thickness: adding another layer to bring loft insulation up to the recommended 270 mm will save energy and money6. That is a specification, not a savings figure, and it is the right starting point: the first question is whether the work was done to the standard, and only then whether it saved.
The savings figure has to come from the impact of measures analysis in the National Energy Efficiency Data-Framework, which assesses the effect of installing home efficiency measures such as loft insulation on household energy consumption23. That analysis is the appropriate source because it compares households that had the measure with comparable households that did not, which is the only way to separate the measure from the weather.
For a single household, the practical method is:
- Record the loft insulation depth before the work, and the date and specification of what was installed.
- Take meter readings on the day the work is completed, and keep them with the paperwork.
- Take readings at the same point in the following heating season, and compare the two heating seasons rather than two quarters.
- Note anything that changed occupancy, heating patterns or appliance use over the same period.
- Get a new EPC after the work to record the modelled change in the rating.
The wider evidence on what retrofit delivers comes from council programmes. Improvements like external wall insulation and heat pumps can reduce energy bills by approximately 25% or £350 per year7. That figure is for a package of measures in a specific programme, and it is reported rather than guaranteed for any individual home.
A shallower package has a smaller modelled effect. Official guidance describes a shallow retrofit which, if starting with a poor baseline, could save around 30% in carbon emissions8. Carbon and cost are different quantities, and a carbon saving does not translate directly into a bill saving.
Keeping records over time
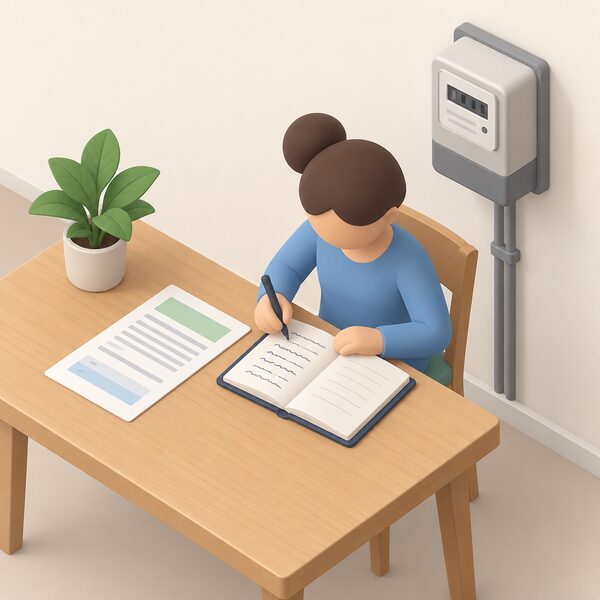
The record is what makes the comparison possible in a year's time, and it is also what a future buyer or assessor will want.
The core documents are the EPC and its recommendation report, the meter readings taken before and after the work, the bills covering both periods, and the installer's specification and any warranty paperwork. Climate Action Wales describes a three-part retrofit report as including an EPC, an Occupancy Assessment detailing how energy is used in the home, and a Condition Report on the building's state of repair5. Where a household has commissioned that level of assessment, the occupancy element is the part that explains why measured savings differ from modelled ones.
A new EPC after the work gives a fresh rating and a fresh recommendation report, and it is the standard way to record the change in the building. The cost is typically £50 to £1505. Where an EPC is obtained for a sale or let, it should be made available to buyers or prospective tenants at no cost, and a buyer receives a copy from the seller that can be reused within the period of validity3.
Readings should be kept even where a smart meter is doing the work automatically. Ofgem's advice after a supplier failure is to take a meter reading as soon as possible and keep a record of it so that the new supplier bills correctly22, and the same habit protects the record across a supplier switch at any time. A smart meter may stop working in smart mode when a household moves to a new supplier, requiring manual readings, and it may work in smart mode again if tariffs or suppliers change22.
For households that want the measurement to be more than a personal record, official scheme rules allow grant recipients to use Smart Meter Enabled Thermal Efficiency Ratings in the evaluation of retrofit28. That is an evaluation method built on smart meter data, and it points to where measurement is heading: from modelled ratings towards measured performance.
What this means for energy independence
Measurement is the part of retrofit that keeps a household honest about what it has actually achieved. A home that knows its baseline, reads its meter and keeps its records is in a position to decide what to do next on evidence rather than on expectation.
The dependence that remains is worth naming. The meter, the in-home display and the data they produce sit inside a supplier relationship: readings go to the supplier, the tariff is set by the supplier, and the display is a window onto a system the household does not control9. A smart meter that loses smart mode after a supplier switch falls back to manual readings22. The EPC, meanwhile, is a model produced to a national method, and its cost figures rest on fuel price assumptions that the household does not set10.
What a household does control is consumption, and the record of it. That record is the basis for judging whether the next measure is worth doing, and it is the only way to tell a real improvement from a mild winter.
Sources28 cited
- Smart meters: your rights and expectations, UK Government, 2025-08-08
- Smart meters, Climate Action Wales, 2026
- Energy Performance Certificates, nidirect, 2026-02-26
- Domestic EPC reform consultation, Scottish Government, 2021-07-23
- Five top tips to cut your energy bills, Climate Action Wales, 2026-03-18
- Energy efficiency in the home, nidirect, 2026-09-02
- High rise retrofit and upgrade programme phase 1, City of Edinburgh Council, 2026-04-20
- Guidance toolkit on building retrofit, Birmingham City Council, 2024-02
- How do smart meters save energy, Smart DCC, 2026
- Technical annex for chapter 2: what EPCs measure, UK Government, 2026-03-09
- Energy Performance Certificate EPC reform consultation, Scottish Government, 2023-07-25
- Approved Document L Volume 1 consultation, Welsh Government, 2026-09-17
- Do you need planning permission for retrofitting, South Oxfordshire District Council, 2025-08-15
- NEED report summary of analysis 2026, UK Government, 2024
- Approved Document L Volume 1 Dwellings, UK Government, 2026
- Smart meters and decarbonisation, Smart DCC, 2026
- Get help with your smart meter, Ofgem, 2026-09-17
- Do you have to have a smart meter by law, Smart DCC, 2026
- Get help with your smart meter, Ofgem, 2026
- Smart meter performance, Ofgem, 2026
- Energy consumer outcomes: proposed implementation, Ofgem, 2026-06-23
- What happens if your energy supplier goes out of business, Ofgem, 2026
- NEED impact of measures data tables 2025, UK Government, 2025-06-26
- Optimised Retrofit Programme case study, Welsh Government, 2024-03
- Approved Document L: conservation of fuel and power, UK Government, 2026-09-17
- Energy Performance of Buildings (Scotland) Regulations 2025 update, Scottish Government, 2025-10
- Letter on reform of domestic EPC rating metrics, Climate Change Committee, 2026-09-19
- Warm Homes: Social Housing Fund Wave 3 scheme guidance addendum, UK Government, 2026-06
 Measured vs Modelled PerformanceWhy does a home use more energy than its rating predicts, and what does that mean for your bills?
 Energy Checks Before BuyingHow energy efficient is the house, and what will it cost to heat?
 Reducing Your BillRanks household electricity and gas uses by share of the bill and sets out what each measure changes, from heating settings and insulation to appliance use and tariff choice.
 The New Build Performance GapWhy does a new build use more energy than its rating promises?
 Home Energy AssessmentsWhich home energy check do you actually need?
 Where to Start ImprovementsThe first steps are assessment, not purchase: read the home's EPC and its recommendation report, see actual consumption on a meter or in-home display, and take the no-cost adjustments such as turning the thermostat down one degree.