
In this guide
The published average for a UK household is 2,700 kWh of electricity and 11,500 kWh of gas a year, the pair of figures Ofgem uses for the headline price cap and the ones most often quoted as the national average1. A newer set took effect on 1 July 2026, cutting medium electricity use to 2,500 kWh and medium gas use to 9,500 kWh, which lowered the headline average bill to £1,663.84 while unit rates rose3.
Both sets are real and both are in use. The 2,700 and 11,500 kWh pair still appears in price cap documents and supplier guides, while the 2,500 and 9,500 kWh pair reflects the most recent review of measured consumption5. Which one applies to a household depends on the date of the document being read, not on the household itself.
The figures are medians and typical values, not predictions. Households are not evenly distributed across energy use profiles: one profile covering 2% of households uses four times more electricity on average than the most common profile6. That spread is the reason a single national average describes the middle of the market and very few individual homes.
What the average UK household uses: the headline figures
The headline numbers come in two layers. The first is the pair used for the price cap: 2,700 kWh of electricity and 11,500 kWh of gas a year, described by Ofgem as the typical UK customer's consumption1. The second is the revised pair that applies from 1 July 2026: 2,500 kWh of electricity and 9,500 kWh of gas, which Ofgem adopted to reflect the decrease in annual energy consumption over recent years3.
The gap between the two is not a contradiction but a revision. The median value used for the headline price cap fell by 7% for electricity and 17% for gas in the 2026 review, and across the full set the electricity values were reduced by 7 to 14% and the gas values by 15 to 20%4. The 2,700 and 11,500 kWh figures remain in circulation because they were the basis of earlier cap periods and still appear in supplier and comparison guides5.
Where the household sits matters as much as which figure is quoted. Median domestic electricity consumption in England and Wales was 2,500 kWh in 2024, and median consumption remained substantially lower than in 2021 by 13% for gas and 9% for electricity10. Across Great Britain, households have reduced their domestic energy consumption by at least 15% on average2.
The composition of household energy use explains part of the pattern. Natural gas was the biggest contributor to household energy consumption, accounting for nearly two-thirds (62%) of the total, followed by electrical appliances at 14% and water and heating at 18%12. Domestic energy consumption accounts for about 30% of the UK's total energy budget, and energy use in homes accounts for 14% of total UK emissions13.
Typical Domestic Consumption Values: what they are and who sets them
Typical Domestic Consumption Values are industry standard values for the annual gas and electricity usage of a typical domestic consumer15. Ofgem uses them to give an idea of how much energy a household could use in a year, which helps in understanding a bill1. They are set by the regulator for the annual gas and electricity usage of a typical domestic household, and they underpin the headline price cap figures quoted in every cap announcement4.
The values were first established in 2003 by Energywatch, the consumer body of the time, and have been revised periodically since15. They are derived using an established methodology that draws on the Department for Energy Security and Net Zero sub-national consumption statistics, based on median consumption rather than mean16. That choice matters: a median is less distorted by the small number of very high consuming homes than an average would be.
The current set, in force from 1 July 2026, gives medium consumption as 2,500 kWh of electricity and 9,500 kWh of gas, with a separate multi-register figure of 3,900 kWh for meters such as Economy 73. The previous set, used in the October to December 2025 cap period, gave 2,700 kWh of electricity, 11,500 kWh of gas and 3,900 kWh for multi-register meters9.
| Value | Electricity (single rate) | Gas | Multi-register |
|---|---|---|---|
| Low | 1,600 kWh | not published in this set | not published in this set |
| Medium | 2,500 kWh | 9,500 kWh | 3,900 kWh |
| High | 3,800 kWh | not published in this set | not published in this set |
The table reflects the Profile Class 1 electricity values and the medium gas and multi-register figures from the 2026 decision and the 2025 cap documents8.
Electricity: around 2,500 to 2,700 kWh a year for a typical home
The electricity figure a household is most likely to see quoted is 2,700 kWh, the medium value used for the price cap through 2025 and still cited in supplier guides1. From 1 July 2026 the medium value is 2,500 kWh, and that is the number behind the current headline bill3.
The range across published sources is wider than the two headline figures suggest. One independent guide puts the average UK home at around 2,500 kWh of electricity a year, roughly 6.8 kWh a day11. Another puts the average British household at 2,700 kWh, about 225 kWh a month5. A third gives 2,500 kWh a year for Great Britain from 1 July, and just over 208 kWh a month3. The differences come from the vintage of the underlying data and whether the figure is a median or a mean.
Daily figures vary for the same reason. On the 2,500 kWh annual figure, daily use works out at roughly 6.8 kWh11. One independent guide puts the average UK household at around 8 kWh a day17. The two are not reconcilable without knowing the annual total each rests on, and daily use swings well above the annual average in winter and below it in summer.
For a household's independence, the electricity figure is the one that can be shifted most directly. It is the total a solar array or a battery would need to offset, and it is the number that determines whether a home's own generation covers its needs. The gas figure, by contrast, is tied to the heating system and the network behind it.
Gas: around 11,500 kWh a year for a typical home
Gas is the larger of the two figures by a wide margin, and the one that has moved most in the latest review. The medium value used for the price cap was 11,500 kWh a year, described by Ofgem as the typical UK customer's gas consumption1. From 1 July 2026 the medium value is 9,500 kWh, a reduction of 17% at the median and 15 to 20% across the set4.
The spread across sources is wider for gas than for electricity. One independent guide gives 12,000 kWh for a household's annual gas use18. Another gives 9,500 kWh a year as the average gas usage3. A third gives 11,500 kWh, about 958 kWh a month5. The 12,000 kWh figure reflects the pre-2026 values, and the 9,500 kWh figure the revised ones.
The reason gas dominates the total is the heating load. Natural gas accounted for nearly two-thirds (62%) of household energy consumption, with water and heating at 18% and electrical appliances at 14%12. A household's gas figure is therefore largely a statement about its heating system, its insulation and its floor area, not about its behaviour in the way electricity use is.
That has a direct bearing on independence. Gas is a networked fuel: a household can reduce the figure through insulation and heating controls, but it cannot generate its own. The only routes to self-sufficiency in heat are electric, which is why the gas figure is the one that has to fall for a home to move off the network. The electricity figure, by contrast, can be met in part by generation on the property.
Low, medium and high users: the full spread of consumption
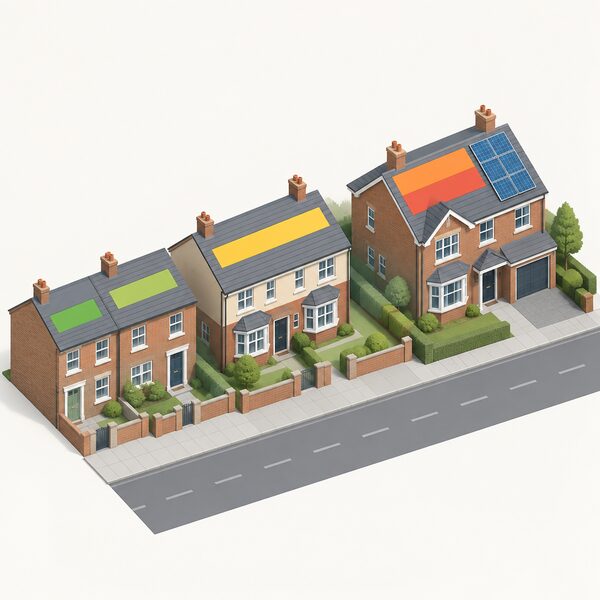
The single average hides a distribution. Ofgem publishes low, medium and high values precisely because households cluster at different levels, and the medium figure is only the middle of three.
For electricity on a single rate meter from 1 July 2026, the values are 1,600 kWh for low use, 2,500 kWh for medium and 3,800 kWh for high8. For a restricted meter such as Economy 7, the equivalent values are 1,900 kWh low, 3,400 kWh medium and 6,100 kWh high8. The restricted meter figures are higher because the meter serves storage heating and hot water as well as general use.
| User | Electricity (single rate) | Electricity (restricted) |
|---|---|---|
| Low | 1,600 kWh | 1,900 kWh |
| Medium | 2,500 kWh | 3,400 kWh |
| High | 3,800 kWh | 6,100 kWh |
The spread is not evenly populated. Households were grouped into 10 different energy use profiles in a study of 5,994 households designed to represent Great Britain across regions and Index of Multiple Deprivation quintiles6. The biggest profile covers 23% of households, while the smallest covers 2%7. One profile comprising 2% of households uses four times more electricity on average than households in the most commonly observed profile6.
At the extremes the difference is stark. Profile 2 has the lowest consumption at 1,555 kWh a year, while the average household in profile 10 consumes four times more electricity than the average household in profile 16. A household comparing itself against the national medium figure is therefore comparing itself against a value that describes roughly a quarter of homes closely and the rest loosely.
For independence, the profile a household sits in determines how much generation or storage would be needed to cover its own use. A low user in profile 2 is within reach of a modest solar array; a high user in profile 10 is not, and would need either a much larger system or a continued reliance on the grid for most of the year.
Profile Class 1 or Profile Class 2: which figures apply to your meter
Profile class is a settlement category in the electricity market, not a label on a bill, and it determines which set of typical values applies. Profile Class 1 covers single rate meters; Profile Class 2 covers restricted meters such as Economy 7, where a separate register records off-peak consumption15.
The split is uneven but not marginal. In 2022, 82% of domestic electricity consumption was on profile class 1 and 18% was on profile class 215. In 2019 the split was 80% and 20% respectively19. Most homes are therefore class 1, and the standard electricity figures apply to them.
The consumption levels differ between the two classes. The mean annual consumption per Profile Class 1 meter was 3,245 kWh in November 2022, and 3,421 kWh in June 201915. For Profile Class 2, the medium value in the 2023 consultation was 4,200 kWh15. The class 2 figures are higher because the meter carries the heating and hot water load as well as general electricity.
The practical point is that a household on an Economy 7 or similar meter should not measure itself against the standard electricity figure. The multi-register value of 3,900 kWh is the one that applies, and it is published alongside the single rate figures in the price cap documents9. A household on a restricted meter that compares its use against 2,500 kWh will conclude it is a high user when it may simply be on a different meter class.
How TDCVs are calculated, reviewed and revised
The values are not recalculated annually on a fixed date. Ofgem reviews them periodically, and a revision takes effect only when the change is material. Material in this context means changes to the values of at least 100 kWh for electricity and 500 kWh for gas when rounded15. That threshold prevents small statistical movements from triggering a full revision.
The calculation method has been stable for over a decade. The values are derived by averaging the two most recent median consumption values, using first, second and third quartiles for low, medium and high20. The underlying data comes from the Department for Energy Security and Net Zero sub-national consumption statistics, based on median consumption16.
The revision history shows the pattern. The values were first established in 2003 by Energywatch15. A revision took effect on 1 October 2023 to reflect the observed decrease in average annual energy consumption21. The 2019 open letter revised the medium electricity value from 3,100 kWh to 2,900 kWh19. The 2026 review, applied from 1 July 2026, cut the electricity values by 7 to 14% and the gas values by 15 to 20%4.
The direction of travel is consistent with the wider statistics. Primary energy consumption in the UK fell by 0.9% on a temperature adjusted basis in the three months to May 2026 compared with a year earlier, and by 1.9% on the same basis in the three months to November 202522. On a fuel input basis, consumption fell by 3.5% over the same 2025 period23. Between 1998 and 2015 there was a 17% fall in the UK's energy consumption11.
"Ofgem updated TDCVs from 1 July 2026 to reflect the decrease in annual energy consumption over the past few years across"
What typical consumption means for your bill
The typical values exist to turn unit rates into a headline bill, and the bill figure moves with them. On the July 2026 values, the headline average bill is £1,663.84, lower than the previous figure even though unit rates rose 5.8% on electricity and 27.7% on gas3. The bill fell because the assumed consumption fell by more than the rates rose.
The earlier figures show the same mechanism in reverse. A typical household on a default tariff was quoted at £102 a month for October to December 2025, against £100 previously24. A typical household bill was £1,714 in August 202425. The headline number is a product of two variables, and a change in either moves it.
For a household, the practical consequence is that the quoted average bill is not a prediction. It is the cost of a specific consumption level at a specific unit rate, and a home using 3,800 kWh of electricity rather than 2,500 kWh will pay proportionally more. The medium usage household on dual fuel was quoted at £146.21 a month and £1,754.94 a year in December 2025, on the then-current values5.
The bill figure also carries a distributional point. Average required energy costs were 6.8% of household income across all households in England on 2025 provisional figures26. For households at the lower end of the income distribution the same consumption represents a much larger share, which is why the typical values are used as a benchmark in support policy rather than as a description of any one home.
Why your own usage may differ from the average
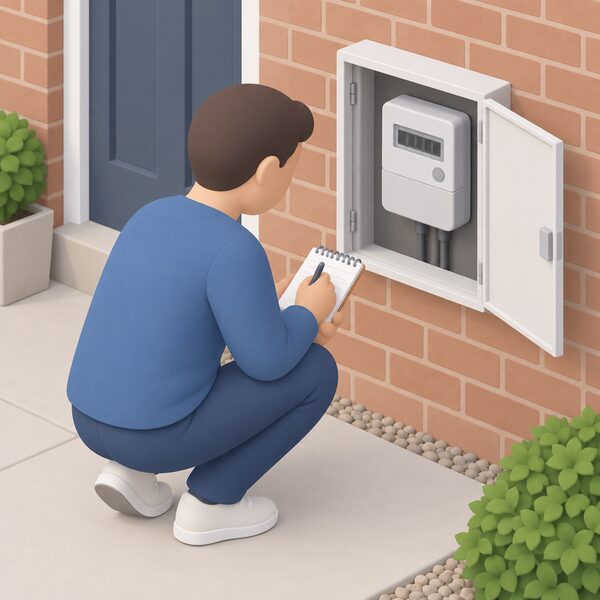
A household's own figure will almost always differ from the national medium, and the reasons are structural rather than a matter of effort. Property size is the largest single factor: the medium user band is defined for a 3 to 4 bedroom home, with 9,500 kWh of gas and 2,500 kWh of electricity a year3. A smaller or larger property moves the figure accordingly.
Heating fuel is the second. A home off the gas grid uses a different fuel entirely, and its electricity figure may be higher or lower depending on what replaces the gas. A home with electric heating sits in the restricted meter class, where the medium value is 3,400 kWh rather than 2,500 kWh8. The national gas figure simply does not apply to it.
Occupancy and appliance use account for the rest. Electrical appliances were 14% of household energy consumption, and water and heating 18%12. A household with more occupants, more appliances or a higher heating setpoint will sit above the medium; one with fewer will sit below. The profile data shows how far the spread runs, from 1,555 kWh a year at the bottom to four times the profile 1 average at the top6.
The honest conclusion is that the national average is a benchmark for comparison, not a target. A household can read its own meter, compare against the low, medium and high values for its meter class, and see where it sits. What it cannot do is assume the medium figure describes its home, because for most homes it does not.
What consumption figures mean for household energy independence
The consumption figures are the starting point for any assessment of a home's independence, because they define the size of the load that has to be met. A household using 2,500 kWh of electricity a year needs to generate or store that much to cover its own use; one using 3,800 kWh needs half as much again. The gas figure, at 9,500 kWh on the current medium value, is the larger load and the harder one to displace3.
The dependence that remains is different for the two fuels. Electricity can be generated on the property and stored, so the grid becomes a backup rather than the sole source. Gas cannot: it is a networked fuel, and a household's only routes to independence in heat are electric, which shifts the load onto the electricity figure rather than removing it. That is why the gas number is the one that has to fall for a home to move off the network.
The trend is in that direction. Households across Great Britain have reduced their domestic energy consumption by at least 15% on average, and median consumption in England and Wales remained substantially lower than in 2021 by 13% for gas and 9% for electricity2. Domestic energy consumption accounts for about 30% of the UK's total energy budget, so household-level reductions feed directly into the national picture13.
What the figures cannot show is how much of a home's use is met from its own generation. The published statistics record consumption, not self-supply, and a household that generates its own electricity still draws from the grid at times and exports at others. The consumption figure is the size of the task; the independence comes from how much of it a home can meet itself.
Sources26 cited
- Energy terms explained, Ofgem, 2026
- Energy statistics, Uswitch, 2025
- How much energy do I use, Uswitch, 2026
- Energy UK explains typical domestic consumption values, Energy UK, 2026
- How much energy do I use, Confused.com, 2025
- A profile comprising 2% of households uses four times more electricity, Nesta, 2025
- Households are not evenly distributed across profiles, Nesta, 2025
- Review of typical domestic consumption values decision, Ofgem, 2026
- Summary of changes to energy price cap 1 October to 31 December 2025, Ofgem, 2025
- National Energy Efficiency Data Framework need report, GOV.UK, 2026
- Energy bill savings 2026, Fuse Energy, 2026
- Green energy statistics, Uswitch, 2024
- Fixing the foundations, Citizens Advice, 2024
- DESNZ annual report and accounts 2025 to 2026, GOV.UK, 2026
- TDCV 2023 call for input, Ofgem, 2023
- Energy price cap benchmark review decision, Ofgem, 2025
- Which energy suppliers are British, Uswitch, 2026
- What is the energy price cap, Energy Saving Trust, 2026
- TDCVs 2019 open letter, Ofgem, 2019
- TDCV decision letter, Ofgem, 2013
- Summary of changes to energy price cap 1 July to 30 September 2025, Ofgem, 2025
- Energy trends and prices statistical release 30 July 2026, GOV.UK, 2026
- Energy trends and prices statistical release 29 January 2026, GOV.UK, 2026
- The history of Ofgem's energy price cap, Energy Helpline, 2026
- UK homes unfit for the challenges of climate change, Climate Change Committee, 2019
- Small wind turbines, MCS Certified, 2026
 Regional Energy ConsumptionHow much gas and electricity does your area use compared with the rest of the country?
 Typical Consumption ValuesOfgem's typical usage figures are what the price cap and most bill comparisons are based on.
 Household Import DependenceGas and oil make up most of what a typical UK home spends on energy, and roughly half of that gas comes from abroad.
 The Full Statistics GuideHow many homes in the UK have solar panels, heat pumps or batteries?
 Official Energy StatisticsWhere can you find the government's official figures on UK energy prices and how much gas and electricity the country uses?
 Energy Debt and ArrearsHow much do households in the UK owe their energy supplier, and how many people are behind on their bills?