
In this guide
Comparing energy tariffs means putting two deals on the same footing: the same annual consumption, the same payment method, the same contract length, and the same treatment of VAT. The headline number most households see is the Ofgem price cap level for a typical dual-fuel household, which is £1,723 a year for the period from 1 October to 31 December 2026, up about £60 on the previous quarter1. That figure is not a cap on any individual bill. It is the cost of a defined amount of energy at the capped unit rates and standing charges, and it only describes a household using roughly the benchmark consumption.
The benchmark behind it is the Typical Domestic Consumption Values, or TDCV. Ofgem uses them "to give you an idea of how much energy you could use in a year, which can help you to understand your bill"1. The medium figures used for the October to December 2025 cap values were 2,700 kWh for electricity, 11,500 kWh for gas and 3,900 kWh for multi-register meters2. From 1 July 2026 the electricity benchmarks change to 1,900 kWh for a low user, 3,400 kWh for a medium user and 6,100 kWh for a high user3.
So a comparison is only as good as the consumption figure fed into it. A household using 1,900 kWh of electricity a year and one using 6,100 kWh will see the same tariff produce very different annual costs, and the gap between the cheapest and dearest deal on the market widens with every extra unit. This page sets out the numbers that drive a comparison, the label that carries them, and the checks worth making on the site and the supplier behind them.
What the Ofgem price cap means for your annual bill
The cap is a limit on the unit rate and standing charge a supplier can charge on a default tariff, not a limit on the total a household pays. Ofgem reviews and sets a level every three months for how much a supplier can charge for each unit of energy and each day of standing charge7. The £1,723 figure for October to December 2026 is what those capped rates produce for a household using the benchmark consumption, and the rise of about £60 on the previous quarter was driven mainly by higher wholesale gas prices1.
The cap applies where a customer has not signed up for a fixed-term contract with their supplier8. It covers default tariffs regardless of how the bill is paid, whether by standard credit, Direct Debit, prepayment meter or Economy 7 meter9. It does not cover fixed tariffs, business energy contracts, heat networks or heating oil1. That distinction matters for comparison: a fixed deal is not capped, so its annual cost is whatever the contract sets, and a household comparing a fixed deal against a default tariff is comparing a known figure against a moving one.
The cap level has moved sharply over recent years. For January to March 2024 the typical dual-fuel household figure under the cap was £1,928 in Scotland scenario modelling10. The benchmark consumption behind the cap has also changed: the April to June 2024 cap was calculated on 12,000 kWh of gas a year11, and the wholesale costs review published in December 2023 used 3,100 kWh for single rate electricity and 12,000 kWh for gas12. Those older figures explain why cap levels from different periods are not directly comparable with each other, and why a comparison should always state the consumption assumption it uses.
For a household's energy independence, the cap is a floor of protection rather than a route to self-sufficiency. It limits what a supplier can charge a passive customer, but it leaves the household exposed to every quarterly review, to wholesale gas prices, and to the standing charge that applies regardless of use. The only levers a household holds are the tariff it chooses, the payment method, and how much energy it uses.
Typical Domestic Consumption Values: the benchmark behind every comparison

TDCV is the yardstick that makes one tariff comparable with another. Ofgem's decision on the review of these values states that TDCV is based on median consumption, derived using an established methodology that draws on Department for Energy Security and Net Zero sub-national consumption statistics13. Median rather than mean matters: it describes the middle household, so half of households use less and half use more.
The values are not fixed forever. Ofgem's stated approach is to review TDCVs every two years, in line with its established framework3. The electricity benchmarks from 1 July 2026 are 1,900 kWh for a low user, 3,400 kWh for a medium user and 6,100 kWh for a high user, each lower than the previous set3. The medium figures used for the October to December 2025 cap values were 2,700 kWh of electricity, 11,500 kWh of gas and 3,900 kWh for multi-register meters2. The April to June 2025 cap letter noted that all figures in it reflected the latest (2023) TDCV14.
The practical consequence is that a comparison run today and a comparison run two years ago may use different consumption assumptions, so the annual costs are not like for like. A household that knows its own kWh figures from a bill is better placed than one relying on the benchmark, because the benchmark describes a median household, not theirs.
"We use typical domestic consumption values (TDCV) to give you an idea of how much energy you could use in a year, which can help you to understand your bill"
Low, medium and high users: where your household sits
The three electricity bands give a household a quick way to place itself. From 1 July 2026 a low user is benchmarked at 1,900 kWh a year, a medium user at 3,400 kWh and a high user at 6,100 kWh3. Ofgem's glossary defines a low user as a consumer who annually uses 2,100 kWh of electricity and/or 11,000 kWh of gas, which is the older definition still in circulation15. The two sets of figures differ, so a household should treat the band as approximate and check its own bill.
Where a household sits is driven by heating, hot water and appliances rather than by floor area alone. Property age and type shift the median: for flats, median gas and electricity consumption was 1% and 7% higher respectively in properties built in 2023 than in 201016. That is a small but real difference, and it shows that the building stock, not just the occupant, moves the number.
The English Housing Survey covers whether households had changed their fuel supplier and/or tariffs and the methods of payment they use to pay for their energy, which is the kind of behavioural data that sits alongside the consumption benchmarks17. For comparison purposes, the band a household picks changes the annual cost it sees, and the higher the band, the more the unit rate matters relative to the standing charge.
Unit rate and standing charge: the two numbers that set your cost
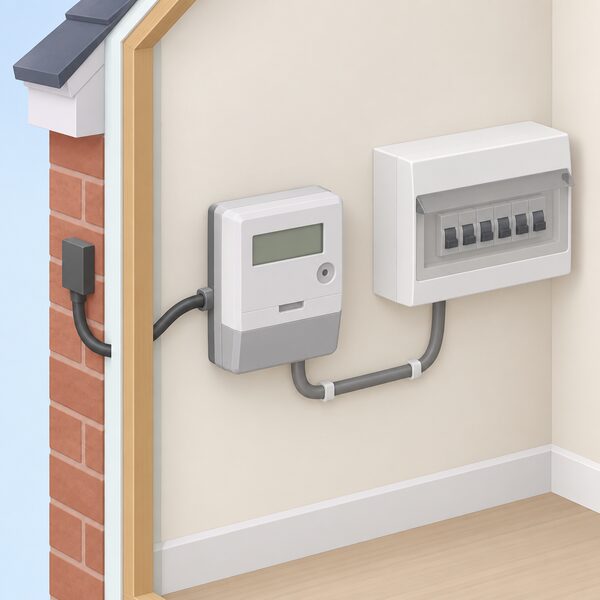
Every domestic bill has one charging structure made up of a standing charge and the unit prices of the gas and electricity18. The unit rate is how much you pay for each unit of gas or electricity you use; the standing charge is the daily fixed cost of supplying gas and electricity to your home6. The standing charge is charged every day whether the household uses any energy or not, so it is the part of the bill that cannot be reduced by using less.
That structure is why two tariffs with the same headline annual cost can suit different households. A low user pays proportionally more of their bill through the standing charge, because there are fewer units over which to spread it. A high user pays proportionally more through the unit rate. Ofgem has consulted on a requirement for suppliers to offer lower standing charge tariffs, seeking views from energy suppliers, energy consumers and the public, consumer groups, charities, industry groups and network companies19. That consultation signals that the balance between the two components is a live policy question, not a settled one.
When comparing, the factors that matter are unit rates and standing charges, whether prices are fixed or can change, the length of any fixed-term contract, the payment methods available, customer service and support, and any additional benefits or incentives6. The first two set the cost; the rest set the risk and the experience.
| Component | What it is | How it behaves |
|---|---|---|
| Unit rate | Price per kWh of gas or electricity used6 | Falls to zero if nothing is used |
| Standing charge | Daily fixed cost of supplying the home6 | Charged every day regardless of use |
| VAT | 5% on energy bills20 | Applied to the total, temporarily 0% on domestic electricity from 1 October 20264 |
The Tariff Information Label: what each line tells you
The Tariff Information Label was introduced as part of the retail market reforms, setting out key terms and conditions as well as relevant information to help consumers compare across suppliers9. Under the current rules, suppliers must prepare a Tariff Information Label for each of their tariffs, and it no longer has to follow a set format, but it must be a clear and comprehensible list of key features in a consolidated format allowing easy comparison7.
The label sits alongside the switching information a supplier must give. That includes telling the consumer if there are other cheaper tariffs they could switch to with the same supplier, estimated annual costs, and an "about your tariff" label7. The estimated annual cost is the number most households use as the comparison figure, and it is only meaningful when the consumption assumption behind it is stated.
One design point from the original consultation still shapes what a household sees: where all other aspects of the tariff are equal, including the charges, then one label should be produced rather than several labels varying only by payment method8. In practice that means a single label can cover more than one way of paying, so a household comparing its own Direct Debit cost against a standard credit cost may need to look further than the label alone.
The details behind the label are usually on the latest energy bill or statement, or in the supplier's app or online account6. Before switching, Ofgem's guidance lists what a household needs: postcode, the name of the current supplier, the name of the current tariff, the amount paid per unit in kilowatt hours, and the amount of energy used each year4. Those five items are what turn a label into a personal projection.

Fixed, variable and time-of-use tariffs: which label matches which deal
There are three main types of tariff: fixed rate, standard variable tariff and multi-rate tariff20. Ofgem research on consumer tariff choices tested options including a 12 months fixed term, a 24 months fixed term and a standard variable tariff21. The label for each carries a different risk profile, and the annual cost on it means something different in each case.
A fixed-rate tariff sets the unit rate and standing charge for the length of the contract, so the estimated annual cost holds only while consumption holds. A standard variable tariff moves with the cap, so its annual cost is a snapshot of the current quarter. A multi-rate tariff splits the day, and the annual cost depends heavily on when energy is used rather than only how much.
Time-of-use tariffs are the clearest example of that. A ToU tariff is a plan where the price of a unit of energy varies during a 24 hour period22. With dynamic ToU tariffs, energy prices can vary continually and are calculated in real-time depending on various factors22. For those deals, a single estimated annual cost is a weaker guide than for a fixed tariff, because the same household can produce different bills on different usage patterns. Pages on time-of-use electricity tariffs and Agile and dynamic half-hourly electricity tariffs set out how the pricing works; the comparison point here is that the label's annual cost assumes a usage shape as well as a usage total.
| Tariff type | What the label's annual cost assumes | What can change it |
|---|---|---|
| Fixed rate | Rates hold for the term21 | Consumption, and the end of the term |
| Standard variable | Current capped rates1 | Each quarterly cap review |
| Multi-rate | A split between rate periods20 | When energy is used, not just how much |
| Dynamic time-of-use | Real-time prices at the time of use22 | Wholesale prices and half-hourly behaviour |
VAT at 0% on domestic electricity: what changed on bills
Domestic energy bills have carried VAT at 5%, shown as a line on the bill20. From 1 October 2026 that changes for electricity. The temporary zero rate of VAT applies to qualifying supplies of domestic electricity in Great Britain for the period 1 October 2026 to 31 March 20274. The government announced the measure as a cut from 5% to 0% on electricity bills, funded from a cancelled digital identity programme5.
Two things follow for comparison. First, an annual cost quoted before 1 October 2026 includes 5% VAT on electricity and one quoted after does not, so the two are not directly comparable unless the VAT treatment is stated. Second, the zero rate is temporary and applies to qualifying supplies of domestic electricity in Great Britain, so a household comparing a dual-fuel annual cost should check whether the electricity element has been adjusted and whether the gas element still carries 5%.
How the price cap is reviewed and what to watch next
Ofgem updates the price cap every three months25, and revises the cap each quarter8. Each review sets the level for how much a supplier can charge for each unit of energy and each day of standing charge7. The review dates are published in advance: the review for January to March 2027 is due on 25 November 2026, the review for April to June 2027 on 23 February 2027, and the review for July to September 2027 on 26 May 202726.
The methodology itself is under review. Ofgem has consulted on historical debt related costs, proposing to include costs and revenues across all tariff types, not just customers on variable tariffs, with a response deadline of 16 June 202627. An earlier wholesale costs review had a response deadline of 17 January 2024 and noted that any changes to the price cap would, at the very earliest, be made as part of the update for the July to September 2024 cap period12. Separately, the consumption benchmarks behind the headline figure have moved: Ofgem updated its Typical Domestic Consumption Values from 1 July 2026, with the median value used for the headline cap falling by 7% for electricity and 17% for gas27.
For a household, the review cycle is the rhythm of comparison. A standard variable tariff's annual cost changes at each review, so a comparison made in one quarter may not hold in the next. A fixed tariff's does not, which is the trade a household makes: certainty against the possibility that the cap falls below the fixed rate.
Confidence Code and Citizens Advice ratings: checking a comparison site and a supplier

The site a household uses to compare matters as much as the tariff it picks. Official guidance advises using price comparison websites that are accredited by Ofgem, the UK gas and electricity regulator18. Accreditation is the check that the estimated annual costs and cheapest-tariff messages shown are produced to a standard, rather than to whatever commercial arrangement the site holds.
Coverage differs across the UK. In Northern Ireland, the Consumer Council offers an energy price comparison tool to compare electricity and gas tariffs for all suppliers in Northern Ireland28. That matters because the Ofgem price cap does not apply there in the same way, and a household in Northern Ireland comparing tariffs is working from a different regulatory baseline. Advice services also differ: Northern Ireland has its own guidance for households struggling to pay energy bills29.
On the supplier side, the evidence on what drives satisfaction is worth knowing when weighing a deal. Ofgem research with 3,235 energy bill paying adults across Great Britain, conducted from 29 March to 9 April 2024, found that having switched supplier or tariff accounted for 5% of explained variance and 0.6% of total variance in its demographic and energy characteristics model30. In other words, the act of switching explains very little of how satisfied a household is; the service it receives afterwards explains more.
Sources30 cited
- Energy price cap, Ofgem
- Summary of changes to energy price cap, 1 October to 31 December 2025, Ofgem, 2025-08-27
- Review of typical domestic consumption values decision, Ofgem, 2026-05-27
- Temporary zero rate of VAT for domestic electricity in Great Britain, GOV.UK, 2026-10-01
- New PM cuts tax on household electricity bills, GOV.UK, 2026-07-21
- How to check your energy tariff and switch if you find a better deal, British Gas Energy Trust, 2026-07-30
- Guide to the customer communications rule changes, Ofgem, 2018-12
- The retail market review: statutory consultation on RMR domestic proposals, Ofgem, 2013-04
- New standards of conduct for suppliers of domestic consumers, Ofgem, 2013-08-27
- Scottish House Condition Survey 2022: key findings, fuel poverty, Scottish Government, 2024-01
- Default tariff cap level, 1 April 2024 to 30 June 2024, Ofgem, 2024
- Energy price cap wholesale costs review, Ofgem, 2023-12-15
- Energy price cap benchmark review decision, Ofgem, 2025-11-21
- Summary of changes to energy price cap, 1 April to 30 June 2025, Ofgem, 2025-02-25
- Energy terms explained, Ofgem, 2026
- National Energy Efficiency Data Framework need report, summary of analysis 2026, GOV.UK, 2024
- English Housing Survey 2021 to 2022: energy, GOV.UK, 2023-07-13
- Problems with services: consumer advice, Isle of Anglesey County Council, 2025-10
- Requirement to offer lower standing charge tariffs, Ofgem, 2025-09-24
- Understand your electricity and gas bills, Ofgem, 2026
- Understanding consumers' energy tariff choices research report 2024, Ofgem, 2025-07
- POST note 655: time-of-use tariffs, Parliamentary Office of Science and Technology, 2026-09-17
- Check if you are owed money on your energy bill, Ofgem, 2026
- How your electricity or gas bill is calculated, Ofgem, 2026
- Energy price cap explained, Welsh Government, 2026-03-04
- Energy price cap review dates, Energy Saving Trust
- Energy price cap: review of historical debt related costs, Ofgem, 2026-03-25
- Advice if you're struggling to pay your energy bills, nidirect, 2026-09-17
- Energy Performance Certificates, nidirect, 2026-02-26
- What drives consumer satisfaction with energy suppliers, Ofgem, 2025-07
 Reducing Your BillRanks household electricity and gas uses by share of the bill and sets out what each measure changes, from heating settings and insulation to appliance use and tariff choice.
 The Full Tariffs GuideWhich energy tariff suits how you live, and will switching really save you money?
 Typical Consumption ValuesOfgem's typical usage figures are what the price cap and most bill comparisons are based on.
 Dual Fuel TariffsExplains what a dual fuel tariff is, how discounts and single billing work, and where separate gas and electricity contracts remain available.
 Running Costs by FuelHow the cost of heat compares across mains gas, heating oil, LPG, electricity, solid fuel and heat pumps once efficiency and the price cap are applied.
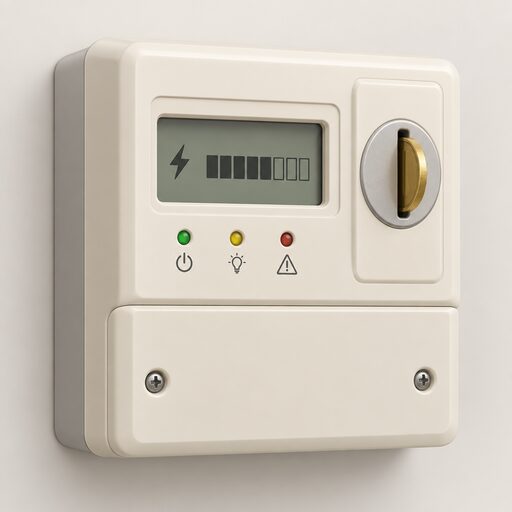 Prepayment and Pay As You GoHow prepayment and pay as you go energy tariffs work in the UK: meter types, top-ups, emergency credit, debt repayment through the meter, price cap treatment and how households move to a credit meter.