

In this guide
The Feed-in Tariff installation statistics are Ofgem's quarterly record of every installation that has completed accreditation on the scheme, published as spreadsheets drawn from the Central FIT Register and running from the scheme's launch on 1 April 2010 to the latest quarter end. The scheme was introduced on 1 April 2010 by the Department of Energy and Climate Change to support small-scale renewable and low-carbon electricity generation in England, Wales and Scotland, and it closed to new applications from 1 April 2019, with all pathways for accreditation now closed1.
The headline numbers from Ofgem's most recent annual report, for Scheme Year 14 (1 April 2023 to 31 March 2024), are a cumulative 870,164 small-scale low-carbon installations holding 6.5 GW of generating capacity, with 869,857 accreditations active at year end after a fall of 206 over the year. Domestic installations account for 829,651 of those accreditations, 95.38 per cent of the scheme, and 2,955 MW or 45.53 per cent of capacity. The scheme generated 8.3 TWh of renewable electricity in that year and was worth almost 1.86 billion pounds1.
Because the register is now essentially fixed, the value of these statistics has changed. They are no longer a deployment tracker: they are the closest thing the UK has to a census of a generation of household microgeneration, with a regional breakdown, a technology split and a size band split, still updated quarterly as accreditations are corrected, transferred or removed.
What the installation reports actually count
Every Feed-in Tariff installation report carries the same definitional line: the data is based on the number of installations that have completed accreditation in the period covered, and the report is built from the installations registered on the Central FIT Register3. That wording matters more than it looks. An installation appears once accreditation is complete, not when the panels were fitted, not when the system was commissioned and not when the household first applied. A quarter's figures therefore reflect administrative completion, which is why quarterly movements in the scheme's later years tracked processing as much as building.
The reports are published as transparency documents on a quarterly cycle, a format unchanged since the first report covering 1 April 2010 to 31 March 20113. Each one gives a breakdown of accredited installations from the scheme's start to the quarter end, so the series is cumulative rather than a set of period snapshots. Ofgem's quarterly statistics pages carry the total number of installations and total capacity by technology alongside installation types, with a further breakdown by region, covering 1 April 2010 to 31 March 2026 in the current release6.
Two structural details affect anyone working with the files. From the report for 31 March 2019 the data was split into three spreadsheet parts, and Ofgem stopped publishing the FIT-ID and Accreditation Number to protect anonymity7. And Ofgem states plainly that its figures can diverge from the department's:
"The information and statistics may therefore differ from those published by the Department for Energy Security and Net Zero."
That divergence is not an error in either series. Ofgem counts accredited installations on its own register; the departmental series, published as accredited official statistics, covers cumulative installation numbers and capacity of schemes under 5 MW installed in Great Britain, broken down by technology, size band and data source8. Different collection routes produce different totals, which is the ordinary condition of reading UK energy statistics.
The figures: size, technology and who owned the installations
The single most useful cut of the data for a household is the size band split, because it separates domestic-scale generation from the commercial and farm-scale projects that dominate capacity. In Scheme Year 14 the 0 to 50 kW microgeneration band held 862,944 installations, 99.21 per cent of the scheme, but only 3,489.9 MW or 53.78 per cent of capacity. The 6,913 installations above 50 kW, just 0.79 per cent of the count, held 2,999.6 MW or 46.22 per cent of capacity1.
| Measure | Scheme Year 14 figure | Share |
|---|---|---|
| Installations, 0 to 50 kW | 862,944 | 99.21% of accreditations1 |
| Capacity, 0 to 50 kW | 3,489.9 MW | 53.78% of capacity1 |
| Installations, above 50 kW | 6,913 | 0.79% of accreditations1 |
| Capacity, above 50 kW | 2,999.6 MW | 46.22% of capacity1 |
| Domestic installations | 829,651 | 95.38% of accreditations1 |
| Domestic capacity | 2,955 MW | 45.53% of capacity1 |
| Non-domestic commercial installations | 3.94% of accreditations | 42.52% of capacity1 |
The eligible technologies were solar photovoltaic, wind, hydro, anaerobic digestion and fossil fuel-derived combined heat and power (micro-CHP), with installations permitted a total installed capacity up to 5 MW, or 2 kW for micro-CHP1. In practice solar dominates the count: 99.56 per cent of solar PV installations on the scheme have a capacity below 50 kW1. Hydro is a small tail, at 301 installations in Scheme Year 1310. That skew is why Ofgem's regional breakdown omits micro-CHP, anaerobic digestion and hydro figures for some regions, because the numbers of those technologies are too low to publish6.
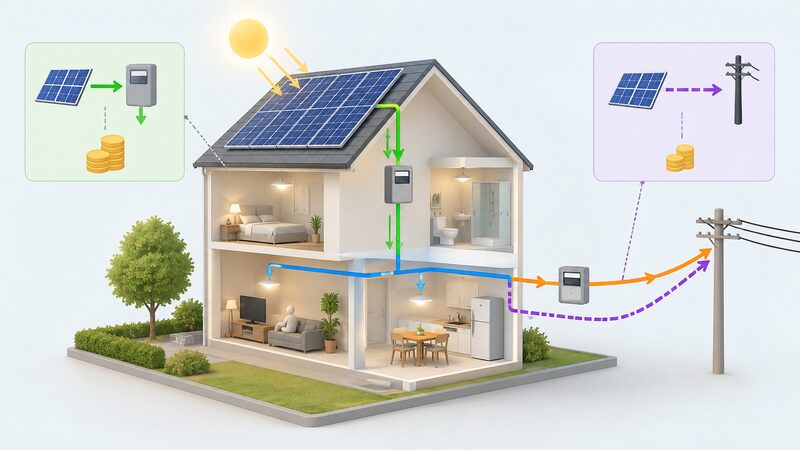
Generation and payment figures complete the picture. Scheme Year 14 produced 8.3 TWh, a fall of around 0.56 TWh or 6.7 per cent on Scheme Year 13, which Ofgem links to tariff rate movements. Approximately 1.3 TWh was exported to the grid, with export payments of around 78.4 million pounds and generation payments of just over 1.84 billion pounds1. Only 14.43 per cent of exported electricity was metered; 85.57 per cent, or 1.13 TWh, was deemed1.
What drives the numbers
Three forces shape the shape of this dataset, and none of them is straightforward demand.
The first is tariff design. Ofgem's scheme guidance sets out that deployment caps placed limits on the total capacity that could receive a particular tariff rate in a particular tariff period, with tariff periods running quarterly for solar PV, wind, hydro and anaerobic digestion installations, and six monthly for micro-CHP. Households and installers responded to those period boundaries, so accreditation volumes clustered ahead of rate steps rather than spreading evenly.
The second is the sheer scale of early uptake. In the single year from 1 April 2011 to 31 March 2012, 217,741 installations were registered under the scheme11. That one year is roughly a quarter of the scheme's entire lifetime register. Government later described the Feed-in Tariff as having driven the installations of 850,000 small-scale renewable projects, and noted uptake outstripping installation predictions by nearly 100,00012. A scheme that overshoots its own forecast by that margin is a scheme whose costs are moving faster than its budget, and the government closed the Feed-in Tariff to new applicants to reduce costs and focus the budget on other sustainable initiatives14.
The third is administrative churn, which is what the data now measures. Active accreditations fell by 206 in Scheme Year 14 while installed capacity rose by just under 5.01 MW on the previous year's total of 6.48 GW1. Installations leave the register at end of eligibility, on ownership change or on removal; capacity can still edge up as larger installations complete late administrative steps. Ofgem also runs compliance work against the register: it closed 39 compliance investigations in Scheme Year 14 and identified almost 3.30 million pounds of error and suspected fraud, preventing 2,993,651 pounds being paid out incorrectly and detecting a further 238,290 pounds paid to generators not eligible to receive it1. Those corrections feed back into the counts.
Geography: Great Britain only, and heavily weighted to the South West
The scheme's territorial extent is England, Wales and Scotland1. Northern Ireland is outside it: departmental statistics describe the series as installations in Great Britain, and the sub-regional releases give installations and capacity by technology type in England, Scotland and Wales8. Anyone comparing the four nations on household microgeneration has to bring in another source for Northern Ireland, such as certified renewable installations in Northern Ireland.
Within Great Britain the distribution is uneven and stable over time. In Scheme Year 14 the South West had the greatest number of installations, 123,256, and the highest proportion of installed capacity at 17.86 per cent1. The Scheme Year 13 report gives the same region 123,307 installations and 17.90 per cent of capacity, and identifies the South East and East of England as the only other regions with more than 100,000 installations, accounting for 11.32 per cent and 10.49 per cent of installed capacity respectively10. At national level, Ofgem's quarterly report for the position at 30 September 2024 puts 85.87 per cent of scheme lifetime installations in England and 6.53 per cent in Wales16.
| Area | Installations | Share of installed capacity |
|---|---|---|
| South West (SY14) | 123,256 | 17.86%1 |
| South West (SY13) | 123,307 | 17.90%10 |
| South East (SY13) | over 100,000 | 11.32%10 |
| East of England (SY13) | over 100,000 | 10.49%10 |
| England (lifetime, at 30 Sep 2024) | 85.87% of installations | 16 |
| Wales (lifetime, at 30 Sep 2024) | 6.53% of installations | 16 |
Regional concentration in the South West, the South East and the East of England reflects irradiance and housing type, and the pattern is worth reading alongside UK solar PV deployment statistics and renewable generation statistics by UK nation.
The rules that still bind the register
The scheme is closed but live. Closure does not affect installations which are already accredited, and support remains payable for the eligibility period, typically 20 years, with tariffs adjusted annually2. The Feed-in Tariff is underpinned by the Feed-in Tariffs Order 2012 as amended and conditions 33 and 34 of the Standard Conditions of Electricity Supply Licence, and the rules for applications were set by the Department for Business, Energy and Industrial Strategy1.
Eligibility periods vary by vintage and technology:
- Most generators: a maximum of 20 years following the eligibility date1
- Solar installations accredited before 1 August 2012: a maximum of 25 years1
- All micro-CHP installations: a maximum of 10 years1
Indexation changed recently. Up to and including FIT Year 16 the annual adjustment was by the Retail Price Index; from FIT Year 17 tariff rates are adjusted each financial year in line with the Consumer Price Index2.
Obligations continue for the duration of the eligibility period. Three changes must be reported to the FIT licensee: installing battery storage with the Feed-in Tariff installation, replacing or moving metering, and replacing generating equipment or adding capacity2. Payments themselves are made by participating licensed electricity suppliers on electricity generated or exported by accredited installations19. All energy suppliers with over 250,000 customers must be part of the scheme, while those with fewer than 250,000 customers can apply to join, which is why Scheme Year 14 had 18 voluntary and 16 mandatory FIT Licensees14. Two suppliers exited the market during that year, and no levelisation payments were left unpaid, so mutualisation was not triggered1. Ofgem continues to publish levelisation reports setting out total payments made by licensees, most recently for the quarter from April to June 202620.
On disputes, Ofgem's position is narrow:
"Only the owner of the installation or those who have been assigned FIT Payment rights (nominated recipients) may complain/raise a dispute"
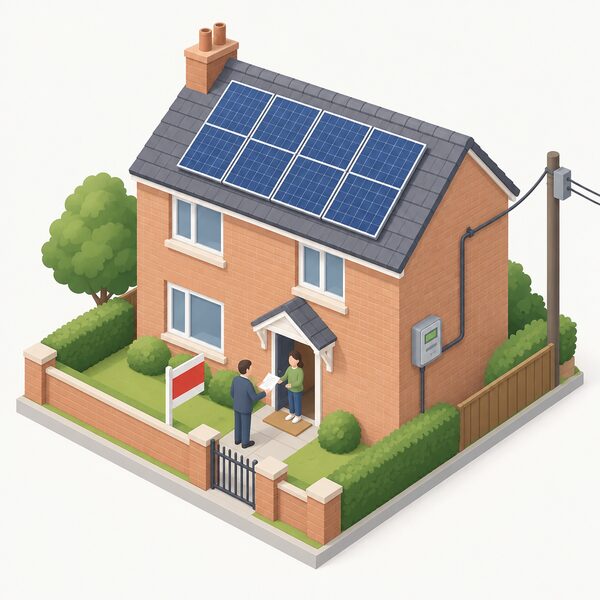
Non-owners may still make certain information requests21. On a house sale, the previous owner should inform Ofgem they no longer own the solar panels, after which the buyer can apply for the remaining payments, and existing contracts run for 20 to 25 years so may still apply to a newly purchased system22.
What the data means for household energy independence
The Feed-in Tariff bought a large stock of household generation that is still there. Around 829,651 domestic installations, holding 2,955 MW, are a permanent reduction in those households' purchased electricity, independent of whether the incentive continues1. That is the durable part of the legacy, and it is the part the installation reports document.
The dependence is equally clear in the same figures. Of the 8.3 TWh generated in Scheme Year 14, approximately 1.3 TWh went to the grid, and 85.57 per cent of that export was deemed rather than metered1. Deeming assumes a fixed share of generation is exported rather than measuring it, and independent guidance describes the deemed rate as estimating that 50 per cent of generated energy is exported14. A household on a deemed arrangement is paid on an assumption, not on its own behaviour, so reducing exports by self-consumption or storage does not reduce the export payment, and increasing them does not raise it. Payments themselves depend on a licensed supplier: generation payments require a generation meter with readings sent by agreed deadlines14. Switching supplier does not change the Feed-in Tariff payment rate, and the old supplier is required to continue making the payments14.
Export arrangements can be moved to the Smart Export Guarantee: the Feed-in Tariff export rate can be discarded and replaced with a Smart Export Guarantee tariff while retaining the generation tariff, though that switch cannot be reversed, and export payments under the Feed-in Tariff can be opted into or out of only once a year23. Feed-in Tariff export rates are reported at around 5 to 7 pence per kWh, fixed but rising with inflation23. Legacy generation rates run far higher for the earliest cohorts, reported as high as 60 pence or more per unit14.
Finally, the money came from bills. The scheme was considered a levy applied to customer bills, and its purpose was to incentivise small-scale production7. In Scheme Year 14 that levy carried a scheme cost of nearly 1.76 billion pounds and qualifying costs of around 17.7 million pounds, with Ofgem's administration costing just under 3.9 million pounds, 0.22 per cent of the levelisation fund1. The Feed-in Tariff is no longer available to new customers, and active contracts end on their designated closure dates without renewal under the scheme25. For households building energy independence now, the installation reports are a historical baseline rather than a route in, best read next to MCS installation statistics, the Renewable Heat Incentive data from the closed scheme and the wider UK home energy statistics.
Sources25 cited
- Feed-in Tariffs Annual Report Scheme Year 14, Ofgem, 2026-09-17
- Feed-in Tariffs scheme closure, Ofgem, 2026-09-17
- Feed-in Tariff Installation Report 31 December 2023, Ofgem, 2024-02-05
- Feed-in Tariff Installation Report 30 September 2023, Ofgem, 2023-11-06
- Feed-in Tariff Installation Report 30 April 2022, Ofgem, 2022-05-23
- Feed-in Tariffs quarterly statistics, Ofgem, 2026-09-17
- Feed-in Tariff Installation Report 31 March 2019, Ofgem, 2019-04-05
- Feed-in Tariff commissioned installations: December 2018, GOV.UK, 2019-01-31
- Feed-in Tariff commissioned installations: November 2016, GOV.UK, 2016-12-22
- Feed-in Tariffs Annual Report Scheme Year 13, Ofgem, 2023-12
- Feed-in Tariffs Annual Report 2011 to 2012, Ofgem, 2012
- Proposals to protect consumers while guaranteeing payments for households with solar, GOV.UK, 2019-01-08
- New laws to guarantee payment for solar homes providing excess electricity, GOV.UK, 2019-06-09
- Feed-in Tariff guide, Uswitch, 2026-07-13
- Sub-regional Feed-in Tariff installations: March 2015, GOV.UK, 2015-04-23
- Feed-in Tariffs (FIT) Quarterly Report Issue 58, Ofgem, 2024-09-30
- Feed-in Tariff Installation Report 30 June 2026, Ofgem, 2026-07-17
- Feed-in Tariffs, Energy Ombudsman, 2026-09-20
- Feed-in Tariffs (FIT) Quarterly Report Issue 63, Ofgem, 2026-03-30
- Feed-in Tariff levelisation report April to June 2026, Ofgem, 2026-08-31
- Feed-in Tariffs dispute resolution, Ofgem, 2026-09-17
- Buying a house with solar panels, Energy Saving Trust, 2026-08-13
- Can I switch energy supplier if I have solar panels?, Uswitch, 2026-06-04
- VAT Fuel and Power manual VFUP4400, HMRC, 2026-09-17
- Smart Export Guarantee, Energyhelpline, 2026-09-20
 The Full Tariffs GuideWhich energy tariff suits how you live, and will switching really save you money?
 MCS Installation StatisticsHow many homes have had solar panels, heat pumps or batteries fitted by certified installers, and is that number still rising?
 Solar Export PaymentsIf you have solar panels, how do you actually get paid for the electricity you send back to the grid?
 Solar PV Deployment StatisticsHow much solar power does the UK actually have, and how much of it sits on people's roofs?
 The Full Statistics GuideHow many homes in the UK have solar panels, heat pumps or batteries?
 Data and Energy IndependenceHow many UK homes actually make their own power, and is that number really growing?