In this guide
Battery electric cars took 29.8% of UK new car registrations in August 2026, with 28,063 units registered in a market of 94,2361. A year earlier the same month gave a 26.5% share from 21,969 units1. Year to date to August 2026, battery electric registrations reached 355,746, against 276,635 over the same period of 2025, a 28.6% increase1.
The cumulative picture is starker still. Britain's two millionth all-electric car was registered in April 2026, with the running total at 2,012,758 units since 20023. In 2025, 473,000 zero emission cars were registered for the first time in the United Kingdom, out of 2,617,000 new vehicles registered for the first time4.
For a household, these are not abstract market figures. They describe how quickly the national car fleet is shifting to a fuel that can be produced at home, from a roof or a tariff, rather than bought from a forecourt. They also describe how quickly demand for home charging is arriving, and where the dependence on the grid, a supplier and a public charging network remains.
UK electric car registrations: the headline numbers
The headline figure for any month is the battery electric share of new car registrations, published by the Society of Motor Manufacturers and Traders in its monthly powertrain tables1. In August 2026 that share was 29.8%, from 28,063 battery electric cars in a total market of 94,236 units, itself up 13.7% on August 20251. The same table shows the year-to-date position: 355,746 battery electric registrations, a 25.62% share, against 276,635 and 21.86% over the same months of 20251.
The cumulative count matters as much as the monthly one. The two millionth all-electric car was registered in April 2026, taking the total since 2002 to 2,012,7583. That milestone arrived alongside a 59.1% rise in EV registrations in that month3. Earlier markers show how compressed the growth has been: more than 800,000 EVs registered since 2018 by September 2023, and a rate of one electric vehicle registered every 60 seconds in August 20236.
Government guidance put more than one million electric cars on UK roads as of December 20247. The Department for Transport's vehicle licensing statistics record 2,617,000 vehicles registered for the first time in 2025, of which 473,000 were zero emission cars4. Those are accredited official statistics, which gives them a different standing from trade body commentary4.
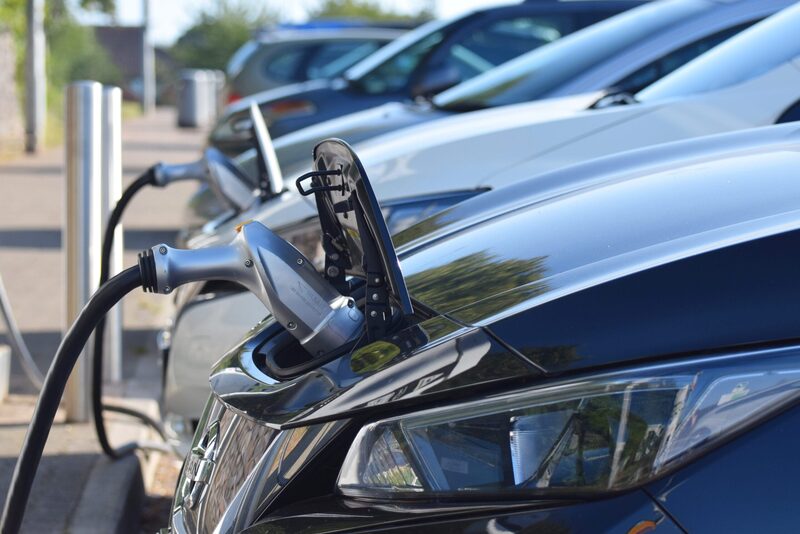
How many electric cars were registered in the latest month: 28,063 in August, 29.8% of the market

August 2026 delivered 28,063 battery electric registrations, a 29.8% share, up 27.7% on the 21,969 units of August 2025, when the share was 26.5%1. The total market that month was 94,236 units, 13.7% larger than the 82,908 units of August 20252.
August is a low-volume month, sitting between the March plate change and the September one, so its absolute numbers are smaller than the spring and autumn peaks. July 2026, by contrast, saw 43,106 battery electric registrations at a 27.5% share, a 44.5% increase on the 29,825 units of July 20258. September 2025 produced 72,779 battery electric registrations, a 23.3% share and a 29.1% increase on the 56,387 units of September 20249.
| Month | BEV registrations | BEV share | Change on year |
|---|---|---|---|
| August 2026 | 28,063 | 29.8% | 27.7%1 |
| July 2026 | 43,106 | 27.5% | 44.5%8 |
| September 2025 | 72,779 | 23.3% | 29.1%9 |
| August 2025 | 21,969 | 26.5% | 14.9%10 |
The pattern is that share and volume move independently. A strong September can lift volume sharply while the share rises only modestly, because the whole market expands at the same time. Reading a single month in isolation, without the year-earlier comparison, will mislead.
BEV, PHEV and hybrid registrations: what each figure counts
Three powertrain categories sit behind the headline numbers, and they are not interchangeable.
Battery electric vehicles (BEVs) run on a battery alone, charged from mains electricity. They are the category that can be fuelled at home from a domestic supply. In August 2026 they took 29.8% of the market1.
Plug-in hybrid electric vehicles (PHEVs) combine a battery and electric motor with a petrol or diesel engine, and can be charged from a plug but also run on fuel. They took 14.5% of August 2026 registrations, from 13,707 units, a 39.8% increase on the 9,803 units of August 20251. Year to date to June 2026, PHEVs reached 148,132 registrations, a 13.02% share11.
Hybrid electric vehicles (HEVs) have no plug. They recover energy through braking and assist a combustion engine, but all their energy comes from fuel. They took 12.7% of August 2026 registrations, from 11,940 units, up 26.3% on the 9,456 units of August 20252. Year to date to August 2026 they stood at 194,327 registrations, a 13.99% share1.
| Powertrain | August 2026 units | August 2026 share | Year to date 2026 |
|---|---|---|---|
| BEV | 28,063 | 29.8%1 | 355,7461 |
| PHEV | 13,707 | 14.5%1 | 148,132 to June11 |
| HEV | 11,940 | 12.7%2 | 194,3271 |
The distinction matters for a household because only the first two categories draw electricity from a home supply. A conventional hybrid never does, so its growth adds nothing to domestic charging demand and nothing to a home's ability to run a car on self-generated power.
The trend over recent years: from 267,203 to 473,348 registrations a year

The annual figures show a market that has moved from a niche to a substantial minority in under a decade. In December 2018, pure electric cars numbered just 15,474 registrations12. By 2022 the battery electric car parc had reached 652,341 vehicles13. By September 2023, more than 800,000 EVs had been registered since 2018, with 812,717 battery electric registrations between January 2018 and August 2023 and 193,221 in the first eight months of 2023 alone6.
The pace then accelerated. Battery electric registrations for the year to June 2025 stood at 284,579, a 25.01% share11. By the year to August 2025 they had reached 276,635 for the January to August period, a 21.9% share10. The equivalent 2026 period delivered 355,746, a 25.62% share1. December 2025 alone contributed 47,139 battery electric registrations, a 32.2% share of that month14.
The annual totals published in licensing statistics give the cleanest comparison: 473,000 zero emission cars registered for the first time in 2025, within 2,617,000 first registrations overall4. The cumulative count passed two million all-electric cars in April 20263.
"electric car and van deliveries are at record levels, up 44.5% and 74.1% last month"
Growth has not been uninterrupted. The market contracted in some months, and tax changes bit into registrations in April 202516. The direction across the period is nonetheless consistent, and the year-on-year comparisons in the monthly tables are the most reliable way to see it.
Who is registering electric cars: private buyers, fleets and businesses
The split between private buyers and fleets explains much of the shape of the data. Fleet registrations accounted for six in ten cars registered in August 2024, or 51,329 units17. That weighting means company car tax treatment, salary sacrifice and fleet replacement cycles drive a large share of electric uptake, and private demand responds to different pressures.
Private buyer engagement has been slower. In 2023, 8.8% of private registrations were battery electric, a ratio of one in 11.418. In the first half of 2022, the private share of new battery electric registrations was 36.3%6. The Society of Motor Manufacturers and Traders has argued that consumer support is key to a faster and fairer transition as the market enters a new phase6.
The household relevance is direct. A fleet or business car is typically charged at a workplace or on a public network, while a privately bought car is far more likely to be charged at home. The private share therefore shapes how much domestic charging infrastructure is needed, and how much of the running cost falls on a household electricity bill rather than a fuel card.
Electric cars versus petrol and diesel: market share and decline
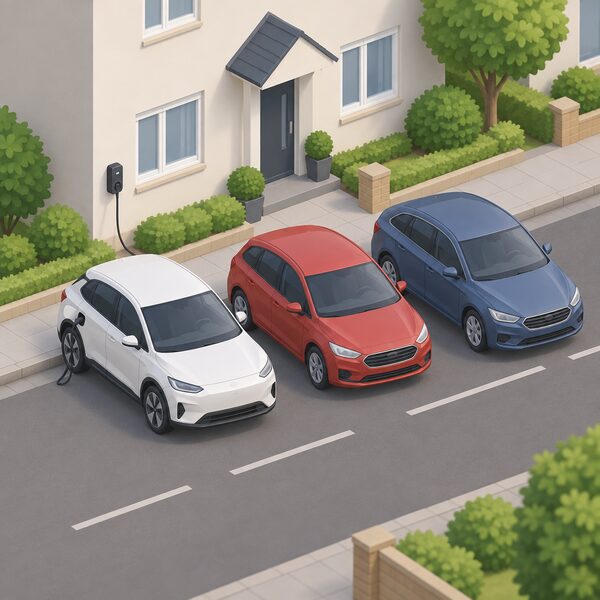
Petrol and diesel registrations have fallen as electrified powertrains have taken share. In January 2025, petrol car registrations dropped by 15.3% to comprise just over half the market, at 50.3%16. In April 2025, petrol and diesel registrations fell by 22.0% and 26.2% respectively19.
The comparison is not simply electric against combustion, because hybrids sit between them. Conventional hybrid uptake fell 1.6% in October 2024, alongside a decline in plug-in hybrid registrations that month20. In February 2025, plug-in hybrids reached 7,273 units, up 19.3%, while conventional hybrids reached 11,431 units, up 7.9%21.
| Powertrain | Period | Figure |
|---|---|---|
| Petrol | January 2025 | 50.3% share, down 15.3%16 |
| Petrol | April 2025 | down 22.0%19 |
| Diesel | April 2025 | down 26.2%19 |
| PHEV | February 2025 | 7,273 units, up 19.3%21 |
| HEV | February 2025 | 11,431 units, up 7.9%21 |
The practical reading is that a buyer choosing between fuels in 2026 faces a market where battery electric is close to a third of new registrations, plug-in hybrids add roughly one in seven, and conventional hybrids a similar share. Petrol and diesel together still account for the largest single block, but the direction of travel in every monthly table is away from them.
What the numbers mean for household energy independence
An electric car is the one major household energy load that can be met entirely from a domestic supply, if the home has the generation and the charging equipment to do it. That is what connects registration statistics to energy independence: every additional battery electric car is a vehicle that could, in principle, be fuelled from a roof, a home battery or a tariff rather than from a forecourt.
The scale of the opportunity is visible in the housing data. In England, 608,000 households reported having a plug-in electric vehicle available in 202322. Energy Consumption in the UK, published as accredited official statistics, provides the national framework for how that electricity is used and supplied23.
The dependence that remains is real and worth stating plainly. A home-charged car still draws from the grid unless the household has its own generation, and even then most charging happens outside the hours a roof produces. It depends on a supplier, on a meter, and on a connection. Public charging, at 121.3 devices per 100,000 population in July 2025, is the fallback for journeys beyond the home5. And the vehicle itself depends on a manufacturer for software, parts and warranty, which is a commercial relationship no household controls.
There is also a regional dimension. Support for household energy measures has varied across the UK nations, with Scotland recording an average of 118 Energy Company Obligation measures per 1,000 households against 81 in Wales and 77 in England25. That pattern of uneven support is a reminder that the ability to charge at home is not evenly distributed, and that off-street parking, not just income, determines whether home charging is possible at all.
Charging at home: what the statistics imply for cost and infrastructure
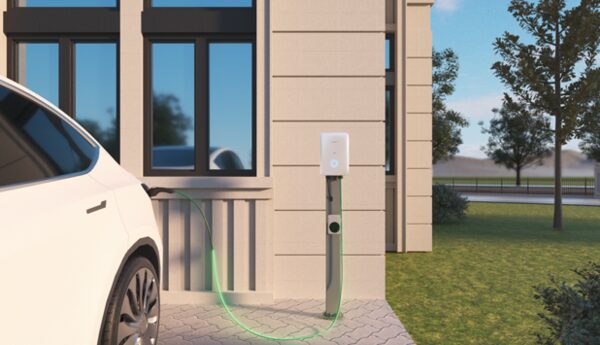
The charging figures that accompany the registration data describe a network still being built out. At 1 July 2025, the UK had 121.3 public charging devices per 100,000 population5. The Department for Transport publishes the underlying tables, with monthly public charger counts by country and region26.
Grant support for home charging has been a smaller programme than the registration numbers might suggest. Home charging grant schemes funded 10,833 installations in the 12 months to 1 July 202627. The charging device grant scheme statistics are published as official statistics in development, which is a weaker status than accredited official statistics and means the figures may be revised28.
| Measure | Figure | Date |
|---|---|---|
| Public charging devices | 121.3 per 100,000 population5 | 1 July 2025 |
| Home charging grant installations | 10,833 in 12 months27 | to 1 July 2026 |
| Grant scheme statistics status | Official statistics in development28 | 26 November 2025 |
Government guidance on electric vehicle costs, charging and infrastructure was updated with vehicle tax rates on 10 April 202524. That update is the reference point for how running costs are treated, and it sits alongside the registration data rather than replacing it.
The independence question for a household comes down to three things the statistics can and cannot answer. They show how many cars capable of home charging are being sold, which is a strong and rising number. They show how much public charging exists, which is a growing but unevenly distributed network. They do not show how many of those cars are actually charged at home, because no registration dataset records it.
Sources28 cited
- Electric vehicle registrations, Society of Motor Manufacturers and Traders, August 2026
- EVs lift August new car market but September is key test, Society of Motor Manufacturers and Traders, August 2026
- Two millionth electric car registered as market rebounds strongly from tax changes, Society of Motor Manufacturers and Traders, May 2026
- Vehicle licensing statistics, United Kingdom: 2025, Department for Transport, 29 April 2026
- Electric vehicle public charging infrastructure statistics: July 2025, Department for Transport, 1 July 2025
- Consumer support key to faster and fairer EV transition as market enters new phase, Society of Motor Manufacturers and Traders, September 2023
- Accelerating to net zero: responding to the CCC progress report, Department for Energy Security and Net Zero, 17 December 2024
- Huge EV boost in July yet mandate gap persists, Society of Motor Manufacturers and Traders, July 2026
- September new car market delivers record number of EVs, Society of Motor Manufacturers and Traders, October 2025
- New car market shrinks in August but EVs reach record share for the year, Society of Motor Manufacturers and Traders, August 2025
- EV market hits new high but target gap remains, Society of Motor Manufacturers and Traders, June 2026
- December EV registrations, Society of Motor Manufacturers and Traders, December 2018
- Britain gets back in the driving seat with more than a million EVs on the road, Society of Motor Manufacturers and Traders, 2022
- Best month ever for new EV registrations as market grows in all important plate change March, Society of Motor Manufacturers and Traders, March 2026
- EV mandate debate needs facts not anti-industry fiction, Society of Motor Manufacturers and Traders, July 2026
- EV share rises despite contracting market but tax hikes threaten targets, Society of Motor Manufacturers and Traders, January 2025
- August new car market holds steady ahead of critical plate change month, Society of Motor Manufacturers and Traders, August 2024
- New car market delivers best year since 2019 as fleets fuel growth, Society of Motor Manufacturers and Traders, January 2024
- New car market falls in April as tax changes bite, Society of Motor Manufacturers and Traders, April 2025
- EV deliveries rise in October as overall market shrinks, Society of Motor Manufacturers and Traders, October 2024
- EVs account for one in four new car registrations in flat February market, Society of Motor Manufacturers and Traders, February 2025
- English Housing Survey 2023 to 2024: low carbon technologies in English homes fact sheet, Ministry of Housing, Communities and Local Government, 2023 to 2024
- Energy Consumption in the UK (ECUK) 2025, Department for Energy Security and Net Zero, 20 April 2026
- Electric vehicles: costs, charging and infrastructure, Department for Transport, 10 April 2025
- Tackling fuel poverty in Scotland: a strategic approach, Scottish Government, December 2020
- Electric vehicle charging infrastructure statistics: data tables (EVCI), Department for Transport, 26 February 2026
- Grant schemes for electric vehicle charging infrastructure statistics: 1 July 2026, Department for Transport, 1 July 2026
- Electric vehicle charging device grant scheme statistics: October 2025, Department for Transport, 26 November 2025
 EV Charging Device StatisticsHow many public charging points are there in the UK, and why do different sources give different totals?
 Solar PV Deployment StatisticsHow much solar power does the UK actually have, and how much of it sits on people's roofs?
 Home Battery Install StatisticsHow many homes in the UK actually have a battery, and is that number growing quickly?
 Data and Energy IndependenceHow many UK homes actually make their own power, and is that number really growing?
 UK Electricity Generation MixBreaks down the shares of gas, wind, nuclear, solar, biomass, hydro and imports in UK electricity generation, how those shares move by hour and season, where the published figures come from, and what the mix means for a household's energy independence.
 Public EV Charging PricesCovers the published price series for public charging, how per-kWh rates differ by network and speed, and how they have moved over the past year.