
In this guide
The short answer is that the UK sits high on electricity and low on gas. In the second half of 2025, household electricity prices in the UK were higher than in all but three EU states, and 18% above the EU average1. Over the past two years the UK has been third or fourth highest out of the EU and UK combined1. On gas the picture inverts: UK household gas prices were 34% below the EU average and less expensive than in all but seven EU states1.
The gap between the two fuels is the number that matters most for a household. The UK's electricity to gas price ratio has been put at 3.7, described as the worst ratio in Europe, and at 3.97, described as the highest in Europe2. A separate parliamentary committee put the ratio at 4:1, one of the highest in Europe4. That spread is what makes the UK unusual: it is not that British energy is uniformly expensive, but that electricity is expensive relative to gas in a way few European markets match.
The comparison is also less stable than a single ranking suggests. UK domestic electricity prices are around the median of those in Western Europe on one independent reading5, while capital city comparisons put the UK fourth among European capitals in April 20256. Different baskets, tax treatments and dates produce different league tables, and the sections below set out which figure comes from where.
What the published figures actually show
The headline comparison comes from official statistics covering the second half of 2025. Household electricity prices in the UK were higher than in all but three EU states and 18% above the EU average, while gas prices for households were 34% below the EU average and less expensive than in all but seven EU states1. The same release notes that lower prices in the UK have meant it has been third or fourth highest out of the EU and UK in the past two years, a phrasing that captures how narrow the gaps at the top of the table are1.
Independent work points in a slightly different direction. The UK Energy Research Centre's consumer bills project puts UK domestic electricity prices around the median of those in Western Europe5. That is not a contradiction so much as a different question: a median position across a wider set of countries, including those with higher taxes and network costs, sits alongside a top-four position against the EU specifically.
Capital city comparisons add a third reading. Figures comparing electricity prices in European capital cities in April 2025 put the UK fourth6. Capital city prices reflect urban network costs and local taxation, so they can diverge from national averages.
| Measure | UK position | Period | Source |
|---|---|---|---|
| Household electricity vs EU average | 18% above | Second half 2025 | 1 |
| Household gas vs EU average | 34% below | Second half 2025 | 1 |
| Electricity ranking out of EU and UK | Third or fourth highest | Past two years | 1 |
| Electricity vs Western Europe | Around the median | Current | 5 |
| Electricity among European capitals | Fourth | April 2025 | 6 |
The unit price figures behind these comparisons are given in euro terms in one independent dataset, which records a UK consumer price including taxes of 0.272 per kWh for electricity and 0.238 for gas in the second half of 20247. Those two numbers are the raw material for the ratio discussed below.
The electricity to gas ratio is the UK's real outlier
If one figure explains why the UK looks different from its neighbours, it is the ratio between the electricity price and the gas price. The Environmental Audit Committee put it at 3.7, calling it the worst ratio in Europe2. The Public Accounts Committee described a ratio of 4:1 as one of the highest in Europe4. The Heat Pump Association, citing market data, put the figure at 3.97 and called it the highest in Europe3.
Three official or independent bodies, three slightly different numbers, all pointing the same way. The differences arise from which price series is used, whether taxes are included, and which period is measured. What they agree on is the direction and the scale.
"electricity in the UK is around four times more expensive than gas with a price ratio of 3.7, the worst ratio in Europe"
The ratio matters because it determines the running cost of every heating decision a household makes. A heat pump typically delivers more heat per unit of electricity than a gas boiler delivers per unit of gas, but if electricity costs nearly four times as much per unit, that efficiency advantage is partly or wholly consumed by the price gap. The European Heat Pump Association has published work specifically on the tax treatment of heat pumps versus boilers and the running costs that follow8.
The ratio also explains why the UK's electricity ranking and gas ranking can both be true at once. The UK is not a high price energy market across the board. It is a market where one fuel is cheap by European standards and the other is expensive, and the gap between them is wider than anywhere comparable.
What drives the UK's position
The dominant driver is gas. The rise in the price cap is overwhelmingly caused by the increase in wholesale costs of energy, primarily the cost of gas, bought and sold on a global market9. Because gas fired generation sets the marginal price of electricity in the GB market, wholesale gas costs pass into electricity unit rates even for households that buy no gas at all.
That mechanism has a long history. The amount companies pay for fuel to run power stations, mainly gas, has spiked sharply in recent years, with the extra cost passed on to consumers10. Energy bills rose by about £370 from 2004 to 2008 driven by rising fossil fuel and particularly gas prices11. The pattern is not new; the scale is.
Domestic factors compound the wholesale effect. The energy bill crisis has been attributed to soaring global gas prices combined with energy supplier failures, rising living costs and longstanding underinvestment in green homes12. The Climate Change Committee has estimated that the average annual energy bill for UK households is around £40 higher than if insulation rates from pre-2012 had continued for the last decade13.
Efficiency has partly offset the price rises. UK domestic electricity bills have not increased at the same rate as prices over the past five years, due to the effects of energy efficiency policies designed to reduce overall consumption5. On the longer view, energy bills are actually down since the Climate Change Act was passed in 2008, reflecting improved energy efficiency, even though energy prices have risen15. Households are nonetheless paying more for energy now than in 1970, and a lot more than they were ten years before that comparison was made10.
How the position differs across the UK nations

The price cap sets maximum prices for a unit of energy and daily standing charges for customers in each energy supply region of Great Britain1. That means England, Scotland and Wales are covered by the cap, and Northern Ireland is not part of the same mechanism. Within Great Britain the cap level varies by region, so the same national headline conceals real differences.
The regional spread is wide. For the period 1 October to 31 December 2025, the Eastern region cap level was £167.73 at nil consumption and £926.96 at 3,100 kWh on single-rate metering, while the Southern region was £183.50 at nil consumption and £1,008.32 at 3,100 kWh11. The Northern region stood at £250.64 at nil consumption and £935.17 at 3,100 kWh12. Those nil consumption figures are standing charges expressed annually, and they differ by more than £80 between regions.
Scotland has its own internal split. For January to March 2026, the direct debit single rate electricity unit price was 27.83p for southern Scotland and 28.36p for northern Scotland, while gas was 5.89p per kWh for all of Scotland16. The north of Scotland pays more for the same unit of electricity than the south, a difference that has no equivalent in the gas rate.
| Nation or region | Electricity unit rate | Period | Source |
|---|---|---|---|
| Southern Scotland | 27.83p per kWh | January to March 2026 | 16 |
| Northern Scotland | 28.36p per kWh | January to March 2026 | 16 |
| All of Scotland (gas) | 5.89p per kWh | January to March 2026 | 16 |
| South Wales (SWALEC) | 26.33p per kWh | 2026 | 17 |
Scottish households also face a different housing and fuel poverty context. The price cap stood at £1,928 for the typical dual fuel household in the first quarter of 2024 in Scottish scenario modelling18. The Scottish House Condition Survey covers fuel poverty in detail for the nation19.
Northern Ireland sits outside the cap entirely and has its own market arrangements, so the EU comparisons in this article, which are built on UK statistics covering Great Britain, do not map cleanly onto Northern Ireland households.
The rules that shape the comparison
The price cap is the central rule. It protects consumers from the rapid changes observed in the wholesale energy market in the short term20. It applies to around 20 million GB households on variable tariffs, including 5 million prepayment meter customers and 3 million standard credit customers, while around 11 million households fix their rates14.
The cap has moved sharply over its life. Between winter 2021-22 and April 2022, Ofgem increased the price cap by 54%, and it peaked during 2023 at £4,05921. It then fell to £1,834 for October to December 2023 and £1,568 for July to September 2024, before rising to £1,717 for October to December 2024, higher than pre-energy crisis levels and a 10% rise, an additional £14921.
The Energy Price Guarantee sat alongside the cap during the crisis. From 1 October 2022 it ensured that a typical household in the United Kingdom paid around £2,500 a year on their energy bill, and it was set to run for the next two years22. That intervention was a temporary cap on the unit price, not a permanent change to the market structure.
Payment method changes the price materially. Customers paying by standard credit, meaning cash, cheque or bank transfer, are hit with a significant price premium14. Regional variation persists too: some regions, such as Merseyside and North Wales, pay substantially more than others, such as London14. Any international comparison that uses a single UK figure is therefore an average of genuinely different local prices.
What this means for household energy independence
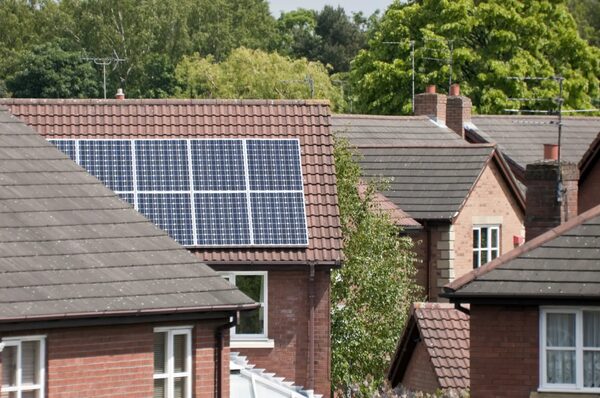
The comparison has a direct bearing on how exposed a household is to decisions made elsewhere. The UK is a net energy importer with a high dependence on gas and oil20. The British energy security strategy set out weaning Britain off expensive fossil fuels, which are subject to volatile gas prices set by international markets, and boosting diverse sources of homegrown energy for greater energy security in the long term24.
There has been measurable progress on electricity. Renewables have cut the UK's dependence on foreign fuels for electricity generation from 65% in 2014 to under 50% today6. That is a real reduction in exposure, and it is the part of the system where domestic generation has displaced imports.
Gas is the remaining dependence. Because gas sets the marginal electricity price, a household that installs solar panels or a heat pump is still connected to an international gas market through the price it pays for electricity. The electricity to gas ratio of 3.7 is the mechanism by which that connection is felt2. A household that generates its own electricity and uses it directly avoids the wholesale price entirely for those units; a household that buys electricity at the cap rate does not.
The insulation gap is the other lever. The average annual energy bill for UK households is around £40 higher than if insulation rates from pre-2012 had continued for the last decade13. That is a small annual figure but it compounds, and it represents demand that domestic generation would otherwise have to meet.
For a household, the practical reading is that the UK's position is not simply "expensive". It is a market where gas is comparatively cheap and electricity comparatively dear, where the gap is the widest in Europe, and where the route to independence runs through using less gas and generating more of your own electricity. The grid, the supplier and the international gas market remain the dependencies that a single home cannot remove.
Sources25 cited
- Household electricity and gas price comparisons, House of Commons Library, 2025
- Electricity prices in Great Britain, Environmental Audit Committee, 2025
- New European heat pump market report highlights need to solve UK's electricity and gas price disparity, Heat Pump Association, 2024
- Energy bills support, Public Accounts Committee, 2024
- Consumer bills project, UK Energy Research Centre, 2026
- Factcheck: why expensive gas, not net zero, is keeping UK electricity prices so high, Carbon Brief, 2025
- VAT report: heat pumps versus boilers, taxes and running costs, European Heat Pump Association, 2024
- British energy security strategy, GOV.UK, 2022
- Energy UK explains April 2025 price cap rise, Energy UK, 2025
- How much energy did The Young Ones use? Home energy use through the decades, Carbon Brief, 2014
- Energy price cap levels, 1 October to 31 December 2025, Ofgem, 2025
- Benchmark maximum charges for the charge restriction period, Ofgem, 2025
- Current programmes will not deliver net zero, Climate Change Committee, 2022
- Ofgem price cap explained, End Fuel Poverty Coalition, 2026
- UK climate action has reduced emissions without increases in household energy bills, Climate Change Committee, 2017
- Balancing investment in clean heat and energy efficiency in Scottish housing retrofit, ClimateXChange, 2026
- Economy 7 guide, Uswitch, 2026
- Scottish House Condition Survey 2022: fuel poverty, Scottish Government, 2024
- Energy bills support: an update, National Audit Office, 2024
- Spring Statement 2022, HM Treasury, 2022
- Energy price cap changes between 1 October and 31 December 2025, Ofgem, 2025
- Government announces Energy Price Guarantee, GOV.UK, 2022
- Government introduces new Energy Prices Bill, GOV.UK, 2022
- Five reflections on the Dieter Helm cost of energy review, Climate Change Committee, 2017
- Electricity prices in Great Britain, House of Lords Library, 2026
 Unit Rates by RegionWhy do electricity and gas prices differ depending on where you live?
 Tariffs in ScotlandWhy do Scottish electricity bills differ from the rest of Great Britain, and why do standing charges cost more in the north?
 Household Energy ConsumptionHow much gas and electricity does a typical UK home use in a year?
 The Full Where Our Energy Comes From GuideWhere does the gas in your boiler and the electricity in your sockets actually come from?
 The Full Rules and Regulation GuideConfused about who actually decides what you pay for gas and electricity, or why rules differ in Scotland and Wales?
 The Full Statistics GuideHow many homes in the UK have solar panels, heat pumps or batteries?