
In this guide
Global temperature records are built from millions of individual measurements, and the headline figure you see in January is the product of several independent teams each processing that raw data in slightly different ways. The result is not one number but a small family of them. In 2024, the warmest year on record, the global average sat at 1.6ºC above pre-industrial levels1. That figure appears across the Climate Change Committee's carbon budget advice for the UK, Scotland, Northern Ireland and Wales, which is why it carries weight in UK policy.
For a household, these records are not abstract. They feed into the heating degree days that determine how much gas or electricity a home uses in a given winter, the weather files that building energy models are built on, and the summertime overheating assessments that now shape new-build standards. The datasets behind the headlines are the same ones behind the numbers on a home's energy performance certificate.

The main global temperature datasets at a glance
There is no single official global temperature record. Several independent groups maintain their own, and the differences between them are small but real. The Climate Change Committee's carbon budget publications cite the 2024 figure of 1.6ºC above pre-industrial levels consistently across its advice for the UK, Scotland, Northern Ireland and Wales1. That consistency matters because it means the same underlying assessment is being used across all four nations' climate policy.
The datasets themselves are not named in the UK policy documents, but the figures they produce are. The 1.3ºC figure for long-term human-induced warming, with a 5th to 95th percentile range of 1.1ºC to 1.7ºC, appears in the Northern Ireland carbon budget advice3. The same 1.3ºC figure, rising at over 0.2ºC per decade, appears in the Scotland carbon budget2 and the Wales carbon budget4. These are not raw measurements but assessed ranges, which is why they come with uncertainty bounds.
| Figure | Value | Source |
|---|---|---|
| Warmest year on record | 2024, 1.6ºC above pre-industrial | 1 |
| Long-term human-induced warming | around 1.3ºC above pre-industrial | 2 |
| Range at 5th to 95th percentile | 1.1ºC to 1.7ºC | 3 |
| Rate of increase | over 0.2ºC per decade | 2 |
| UK average land temperature rise | around 1.2ºC from pre-industrial | 5 |
| UK typical warmest day increase | around 2.8ºC since the 1960s to 1980s | 1 |
For a household, the practical point is that the global record is a composite. It is not one thermometer in one place. It is a statistical product built from thousands of stations, ships and buoys, and the annual figure is an estimate with a range, not a single exact value.
Who measures what: the five major surface records

The global surface temperature record is maintained by several groups working independently. The Met Office, with the Climatic Research Unit, produces the HadCRUT series. NASA runs GISTEMP. NOAA maintains its own record. Berkeley Earth produces another. The Japanese Meteorological Agency maintains a fifth. Each uses the same basic inputs, land station readings and sea surface temperatures, but each applies different quality control, different coverage requirements and different interpolation methods.
The Met Office's role extends beyond the global record. It also produces UK-specific climate projections and warnings. The Met Office has warned that temperatures of 45ºC may now be possible in the current climate8. That is a UK figure, not a global one, and it comes from the same organisation that contributes to the global dataset.
The UK's own statistical infrastructure is separate from the global records but built on similar principles. The Energy Trends and Prices statistical release includes average temperatures, heating degree days, wind speeds, sun hours and rainfall, with data running to the end of December 2025 in the January 2026 release7. These are the numbers that feed into domestic energy consumption statistics and, indirectly, into the heating degree days that determine how much energy a home uses.
The Census 2021 central heating data, published by NISRA, shows how household heating is distributed across Northern Ireland9. That is a different kind of record, but it sits alongside the temperature data in the same statistical ecosystem.
Satellite records: a different way of measuring warming
Satellite records measure temperature differently from surface stations. Instead of thermometers at ground level, they infer temperature from microwave emissions in the lower atmosphere. This means they are not directly comparable to surface records, because they are measuring different things at different heights.
The practical consequence is that satellite records are not used for the Paris Agreement targets or for UK building standards. Those rely on surface records. The Climate Change Committee's advice, which sets the framework for UK carbon budgets, is based on surface temperature assessments1.
Satellite data does have its own uses. It provides global coverage that surface stations cannot match, particularly over oceans and remote regions. But for the purposes of household energy planning, the surface record is the one that matters.
The UK's building energy models use historical weather data, and some standards may need updating to account for climate change10. That is a direct link between the temperature record and the energy performance of a home. If the weather data a model uses is out of date, the model's predictions will be too.
How the datasets differ and why they disagree slightly

The differences between global temperature datasets are small, typically a few hundredths of a degree, but they are enough to change the ranking of individual years. The reasons are technical but understandable.
- Coverage. Some datasets require a minimum number of stations in a region before they will report a temperature for it. Others interpolate across gaps. The Arctic is a particular problem, because it is warming faster than the global average but has few weather stations. Datasets that interpolate more aggressively across the Arctic tend to show slightly higher global averages.
- Ocean measurements. Sea surface temperatures are taken from ships and buoys, and the mix has changed over time. Older records relied more on ship engine intake measurements, which can be biased warm. Modern records use more buoys, which are more accurate. Datasets correct for this transition differently.
- The baseline period. Anomalies are calculated relative to a reference period, and different datasets use different baselines. This does not affect the trend, but it does affect the absolute anomaly figure.
The result is that a year can be the warmest on record in one dataset and second or third in another. The 2024 figure of 1.6ºC above pre-industrial levels is consistent across the Climate Change Committee's publications1, but that is an assessed figure, not a single dataset's output.
For a household, the disagreement is not a reason to doubt the trend. It is a reason to look at the range and the long-term direction rather than fixating on a single year's ranking.
Sea surface temperatures: the record that changed the picture
Oceans cover most of the planet, so their temperature dominates the global average. Global sea surface temperatures have been at record levels since mid-March 20237. That is a significant date, because it marks the point at which the ocean record diverged from previous patterns.
The ocean matters for two reasons. First, water heats and cools more slowly than land, so ocean temperatures smooth out short-term variability and give a clearer picture of the underlying trend. Second, the ocean absorbs most of the excess heat trapped by greenhouse gases, so its temperature is a direct measure of the planet's energy imbalance.
For a household, the sea surface temperature record is less immediately relevant than the land record, but it matters for the UK's climate. The UK's average land temperature has risen by around 1.2ºC from pre-industrial levels5. That is lower than the global average, partly because the UK is surrounded by ocean that has warmed more slowly than the land.
The UK's temperature record was smashed in summer 2022, exceeding 40ºC for the first time6. That is a land record, but it occurred against a background of record ocean temperatures. The two are connected.
"The temperature record was smashed, exceeding 40ºC for the first time"
The 1.5C threshold: how close each dataset puts us
The Paris Agreement set a long-term temperature goal of limiting global warming to "well below 2ºC above pre-industrial levels" and to "pursue efforts to" limit warming to 1.5ºC above pre-industrial levels2. That is the framework against which the datasets are judged.
The current position is that long-term human-induced warming is around 1.3ºC above pre-industrial levels and is rising at over 0.2ºC per decade2. The Northern Ireland carbon budget gives a range of 1.1ºC to 1.7ºC at the 5th to 95th percentile3. That range is important because it shows the uncertainty in the assessment.
The 2024 figure of 1.6ºC above pre-industrial levels is above the 1.5ºC threshold, but it is a single year, not a long-term average. The long-term figure remains around 1.3ºC. The distinction matters because the Paris Agreement targets refer to long-term warming, not individual years.
The Climate Change Committee has stated that current international decarbonisation efforts are unlikely to hold global warming to 1.5ºC11. The Seventh Carbon Budget gives a figure of around 2.5ºC by 2100 under current Nationally Determined Contributions, and states that global emissions would need to be 19 to 22 GtCO2e lower in 2030 to align with a 1.5ºC scenario1.
For a household, the 1.5ºC threshold is not a number that changes day-to-day behaviour. But it is the number that shapes the policy framework, including the building standards and energy efficiency schemes that affect homes.
Where the numbers come from: stations, ships and buoys
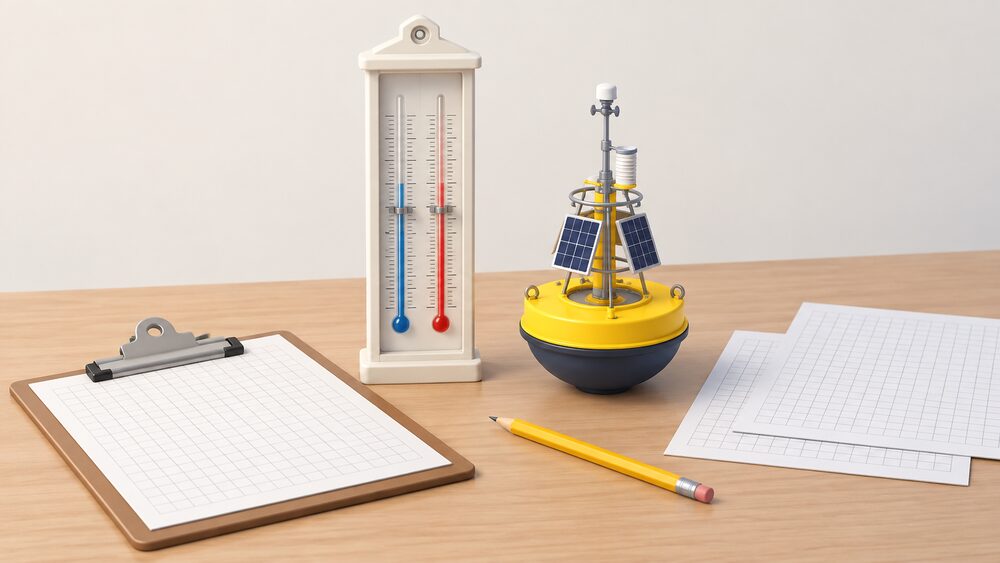
The raw data behind the global temperature record comes from three main sources: weather stations on land, ships at sea, and buoys in the ocean. Each has its own characteristics and its own challenges.
- Land stations. These measure air temperature at a known height above ground, usually around 1.5 metres. The challenge is that stations are not evenly distributed. Europe and North America have dense networks; Africa, South America and the Arctic have sparse ones. Datasets handle this differently, which is one reason they disagree slightly.
- Ships. Ships historically measured the temperature of water taken in for engine cooling, which can be biased warm.
- Buoys. Buoys measure directly at the surface. The transition from ships to buoys has been gradual, and datasets correct for it in different ways.
The UK's own data infrastructure reflects this mix. The Domestic RHI metering guidance, for example, allows a temperature sensor or data from a weather station within a 50 mile radius to measure external air temperature for heat pump and biomass installations13. That is a practical example of how temperature data is used in household energy systems.
The heat pump methodology for the Home Energy Model applies a global minimum temperature difference of 5 K throughout the calculation14. That is a technical parameter, but it shows how temperature data feeds into the models that assess home energy performance.

How to read a headline against the datasets
When a headline says "2024 was the warmest year on record", it is usually referring to one or more of the global surface datasets. The figure of 1.6ºC above pre-industrial levels is the one cited by the Climate Change Committee across its carbon budget publications1. That is a reliable figure because it is an assessed value, not a single dataset's output.
Three checks are worth making before taking a headline figure at face value:
- The baseline. An anomaly of 1.6ºC above pre-industrial levels is not the same as 1.6ºC above the 1981-2010 average, which is a common alternative baseline. The two are not interchangeable.
- Single year or long-term average. The 1.6ºC figure is for 2024 specifically. The long-term human-induced warming figure is around 1.3ºC2. Both are correct, but they answer different questions.
- The dataset. If a headline cites a specific dataset, it is worth knowing that other datasets may rank the same year differently. The disagreement is small, but it is real.
For a household, the most useful thing is to look at the trend rather than the ranking. The UK's typical warmest temperature of the year has increased by around 2.8ºC from the 1960s, 1970s and 1980s to the most recent decade, with more rapid rates of increase in South East England1. That is a long-term trend, not a single-year figure, and it is the kind of number that matters for home energy planning.
The Met Office has warned that temperatures of 45ºC may now be possible in the current climate8. That is a UK-specific warning, and it comes from the same organisation that contributes to the global record. It is a reminder that the global datasets are not just about distant averages; they feed into assessments of what is possible in the UK.
Sources15 cited
- The Seventh Carbon Budget, Climate Change Committee, 2025
- Scotland's Carbon Budgets, Climate Change Committee, 2025
- Northern Ireland's Fourth Carbon Budget, Climate Change Committee, 2024
- Wales' Fourth Carbon Budget, Climate Change Committee, 2024
- UK struggling to keep pace with climate change impacts, Climate Change Committee, 2021
- Deepening our understanding of summertime overheating in homes, Climate Change Committee, 2022
- Energy Trends and Prices statistical release: 29 January 2026, Department for Energy Security and Net Zero, 2026
- Are London's homes ready for a heatwave?, London Assembly, 2026
- CT0082 Central heating, Northern Ireland Statistics and Research Agency, 2024
- Well-adapted energy system, Climate Change Committee, 2026
- Considering summertime overheating in highly insulated homes: factsheet 1a, Welsh Government, 2024
- Considering summertime overheating in highly insulated homes: factsheet 1b, Welsh Government, 2024
- Domestic RHI Guide to metering, Ofgem, 2022
- Home Energy Model: heat pump methodology, Department for Energy Security and Net Zero, 2026
- Low temperature heating, NCM Product Characteristics Database, 2026
 UK Cooling DemandPublished data on air conditioning ownership and home overheating, with projections for summer temperatures in each UK nation, and what rising cooling demand means for summer electricity use.
 How to Read Energy StatisticsWhy do energy figures change after they are first published, and how much can you trust them?
 Fuel Poverty StatisticsWhy do fuel poverty figures differ across the UK, and why is there no single number for the whole country?
 CIBSE Weather DataIf a new home is being checked for overheating, which weather is that based on?
 The Full Statistics GuideHow many homes in the UK have solar panels, heat pumps or batteries?
 How Energy Products Are TestedWhy does a solar panel's datasheet power rating look better than what you actually get on a UK roof?