
In this comparison
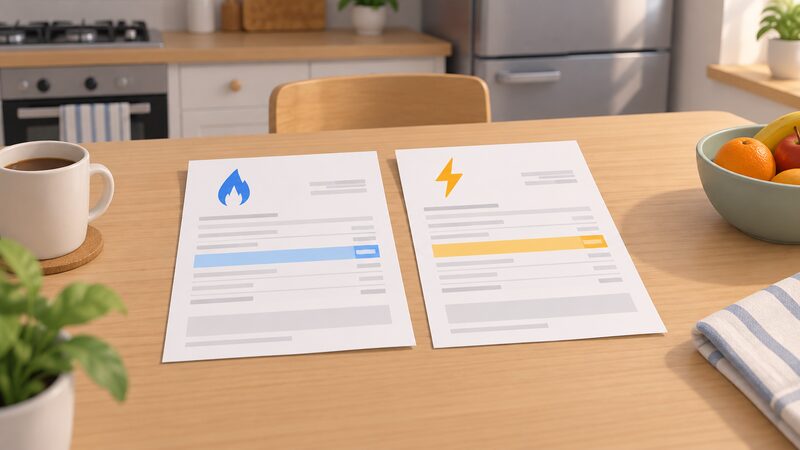
Gas is cheaper than electricity per kWh, and by a wide margin. For the price cap running from July to September 2026 the unit rate was 26.11p per kWh for electricity against 7.33p per kWh for gas1. Independent guidance puts electricity at roughly four times the price of gas per unit, measured in kilowatt hours, on an average out-of-contract variable tariff2. The same comparison appears in official analysis, which records the retail price of electricity per kWh as approximately four times more expensive than gas3.
That ratio is the single most useful number in household energy, because it decides which fuel is worth using for any given job. It is also the number most often misread. A unit rate is not a bill: standing charges, boiler efficiency, the mix of fuels a home uses and the policy costs loaded on to each unit all move the final figure. The cap itself sets a maximum per unit of energy including a daily standing charge, and it applies to default tariffs rather than to fixed, green or time of use deals4.
This page sets out the headline rates, why the gap exists, how the cap is set and revised, what the standing charge hides, and the cases where a higher unit rate still produces the cheaper running cost.
Gas vs electricity per kWh: the headline rates
The gap between the two fuels is not marginal. Electricity costs around four times as much as gas per kWh, and that relationship holds across the independent and official sources rather than being a quirk of one quarter2. The Energy Saving Trust's running-cost illustration used 25.9p per kWh for electricity and 6.3p per kWh for gas, and attributed the difference directly to the unit price of electricity being around four times that of gas8.
The ratio is not fixed. It moves with wholesale prices, with the mix of generation feeding the grid, and with the levies attached to each fuel. Scottish Government analysis, published at the time of a consultation on buildings heat, recorded the retail price of electricity per kWh as approximately four times more expensive than gas3. The Resolution Foundation, looking at the same relationship from a household-cost angle, found electricity unit prices four times those of gas, and noted that this means the higher efficiencies of running costs on electricity do not by themselves close the gap9.
For a household, the practical consequence is that a kilowatt hour of heat from gas is a different purchase from a kilowatt hour of heat from electricity. The two are sold in the same unit, which makes them look comparable, but they are priced on different cost bases. Any comparison of running costs that treats the unit rate as the whole story will mislead, in either direction.
Why gas is about four times cheaper per unit
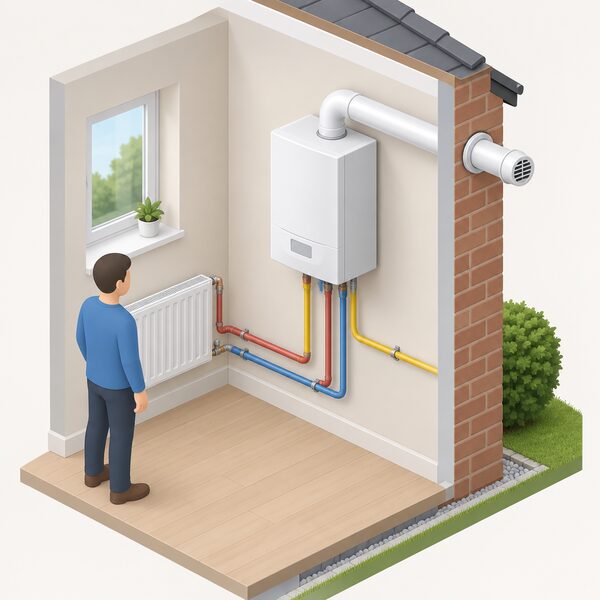
The gap is not a markup imposed on electricity for its own sake. Wholesale gas sets the price of both fuels to a large extent, because gas fired generation still sets the marginal price of electricity across much of the market. Electricity then carries costs that gas does not: generation, transmission and distribution across a national network, and the balancing needed to match supply to demand second by second.
Policy costs widen the gap further, and they fall more heavily on electricity. Levies make up 16% of the final price of electricity and 5.5% of the final price of gas7. The Energy Company Obligation levy rate is three times higher on electricity, at 0.87p per kWh, than on gas7. That asymmetry is deliberate in origin, a way of funding efficiency and environmental programmes through bills, but it means the fuel that a household might want to move towards for low carbon reasons is the one carrying the heavier policy load.
The result is a ratio that independent analysts have modelled in both directions. Nesta's scenario work found the current electricity to gas price ratio at 4.1, and modelled a future in which rebalancing levies towards gas brings the ratio of electricity to gas prices to just below 2.010. That modelling is a scenario rather than a forecast, but it shows how much of the four-to-one gap is a policy choice rather than a physical fact.
"These levies make up 16% of the final price of electricity and 5.5% of the final price of gas."
Unit rates in practice: 7.33p against 26.11p
The clearest way to see the gap is in the cap rates themselves. For the quarter running from July to September 2026, the unit rates were 26.11p per kWh for electricity and 7.33p per kWh for gas1. Earlier in the same year, the January to March 2026 cap set gas at 5.93p per kWh with a 35.09p standing charge6. The gas rate moved between those two quarters, which is a reminder that any figure quoted here has a date attached to it.
| Price cap period | Electricity unit rate | Gas unit rate |
|---|---|---|
| January to March 2026 | 27.69p per kWh6 | 5.93p per kWh6 |
| July to September 2026 | 26.11p per kWh1 | 7.33p per kWh1 |
The two official figures for the January to March quarter, 5.93p per kWh for gas and 27.69p per kWh for electricity, are recorded in the same official guidance and are not reconciled with each other in the documents6. Where a household is checking its own bill against a published rate, the rate that applies is the one for the region and payment method on that bill, not a national headline.
The Energy Saving Trust's illustration used slightly different figures again, 25.9p per kWh for electricity and 6.3p per kWh for gas, in a running-cost example rather than a cap table8. The variation between sources reflects different dates, different tariff assumptions and different purposes. What does not vary is the direction and rough scale of the gap.
The price cap: how and when unit rates are set
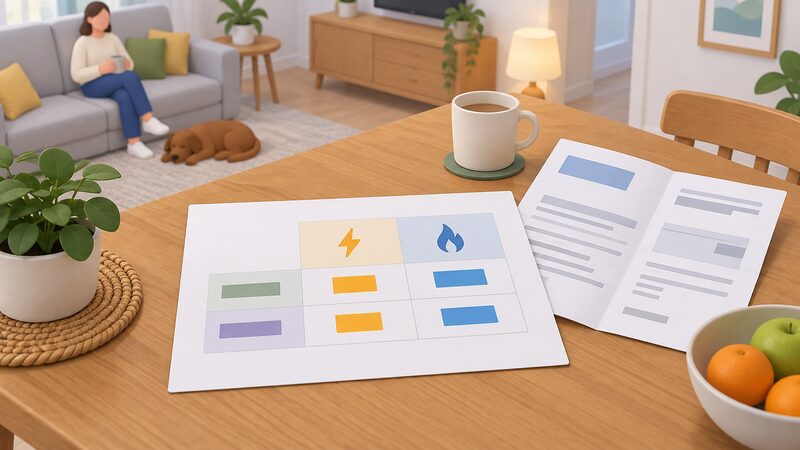
The price cap, as set out in law, sets a maximum that suppliers can charge per unit of energy, including a daily standing charge11. Its purpose is to limit how much suppliers can charge per unit of gas or electricity, based on the underlying costs to serve the customer12. Ofgem updates the cap every three months, and the regulator revises the cap each quarter6.
The cap applies to default tariffs, and it does not matter how the bill is paid, whether by direct debit or with a prepayment meter6. It covers customers on a standard variable tariff paying by standard credit, direct debit, prepayment meter or Economy 7 meter13. These are called standard variable tariffs4. It does not apply to fixed, green or time of use tariffs6.
That distinction matters for the fuel comparison. A household on a fixed deal is not covered by the cap, so its unit rates are set by the contract rather than by Ofgem's quarterly level. The average gas and electricity bill for those on standard variable tariffs is affected almost entirely by the level of the energy price cap, which is set by Ofgem according to wholesale market prices1. A household comparing gas with electricity on its own bill should check which tariff type it is on before assuming the cap rates apply.
The cap has been through several forms. The Energy Price Guarantee, introduced in 2022, limited the price suppliers could charge customers for units of gas14. That scheme is closed, and the current mechanism is the cap described above. For the wider history of levels and announcement dates, see price cap history.
Standing charges: the fixed cost the unit rate hides
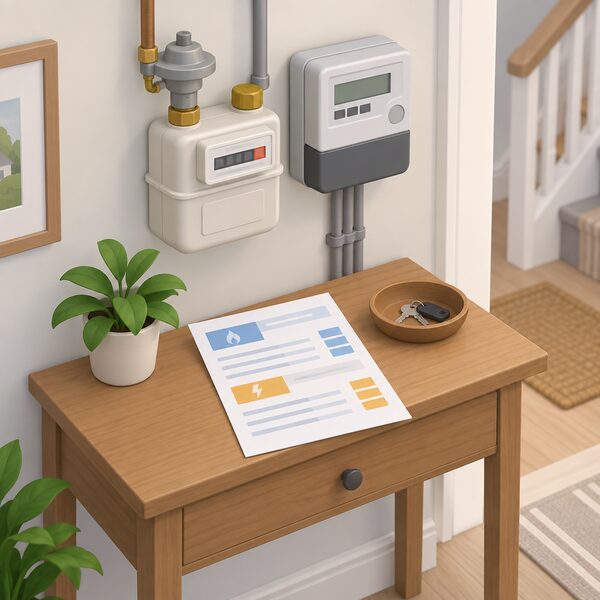
A standing charge on an energy bill covers the fixed costs of providing a home with both gas and electricity, each fuel carrying its own charge, including network connection, meter readings, maintenance and government initiatives5. There is only one charging structure, made up of a standing charge and the unit prices of the gas and electricity15.
For the cap running from 1 July to 30 September 2026, the average standing charges were 57.19p per day for electricity and 29.68p per day for gas5. A separate figure for the same gas charge, 29.04p per day, appears in the same source and is not reconciled with the 29.68p figure5. For electricity, 54.83p per day also appears alongside the 57.19p figure5. Where two figures are given for the same charge, both are recorded here.
Standing charges have been rising independently of unit rates. Ofgem's August 2025 announcement recorded standing charges set to rise by 4% for electricity and 14% for gas16. A gas and electric household was recorded at £0.90 per day in comparison with a household on a different fuel arrangement17. Because the standing charge is fixed, it falls hardest on low-usage households: a home that uses very little gas still pays the daily charge in full, and the unit rate advantage of gas does nothing to offset it. For the full picture of what the charge pays for, see standing charges.
What the unit rate does not tell you: efficiency and running costs
A unit rate comparison assumes both fuels deliver heat at the same efficiency, and they do not. Electric heaters are more efficient than gas boilers, because all the electricity they use is turned into heat2. A gas boiler loses some of the energy in the fuel up the flue. That is a genuine advantage for electricity, and it is the reason a straight unit rate comparison overstates the gap in running costs.
It does not close the gap. Electricity costs around four times as much as gas per kWh, and the Resolution Foundation's finding is that the higher efficiencies of running costs on electricity do not offset unit prices four times those of gas9. A boiler would need to waste three quarters of the energy in its fuel before the two fuels broke even on running cost, which is far beyond normal losses.
The comparison also depends on what is being run. For heating a whole home, the unit rate gap dominates. For a single appliance or a short burst of heat, the picture can differ, because the efficiency advantage of electricity is realised in full and the standing charge is paid regardless. The general principle is that the unit rate sets the direction and the efficiency and usage pattern set the size of the difference. For worked examples on individual appliances, see appliance running costs.
Where the green policy costs sit on your bill
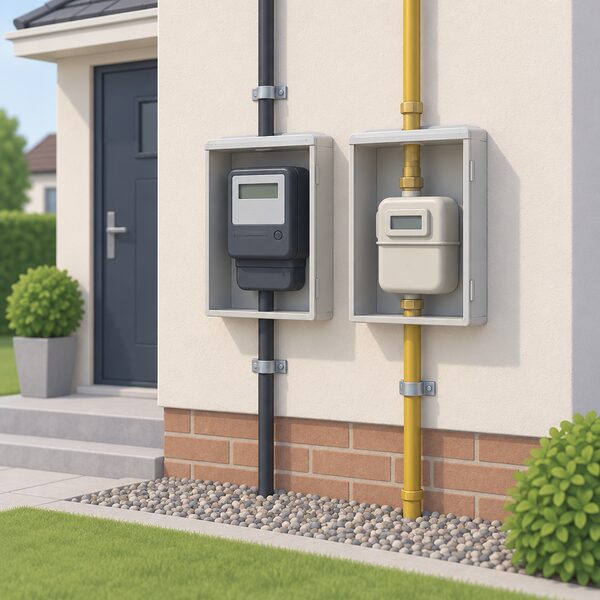
Policy costs are a larger share of an electricity bill than a gas bill, and that is one of the reasons the unit rate gap is wider than the raw cost of generation would suggest. Government environmental and energy efficiency programmes add around £100 on to the average energy bill of £1,30011. Energy and climate change policies make up around 7%, or £89, of the average household energy bill of £1,26011. The two figures come from the same source and are not reconciled with each other.
The split between fuels is clearer. Policy costs make up 16% of the £884 electricity bill and 6% of the £833 gas bill for a typical household, on figures for October to December 20247. The same source records levies as 16% of the final price of electricity and 5.5% of the final price of gas7. A separate breakdown gives 4% of gas bills and 10% of electricity bills11.
| Measure | Electricity | Gas |
|---|---|---|
| Share of final price, levies | 16%7 | 5.5%7 |
| Share of bill, policy costs | 10%11 | 4%11 |
| Typical annual bill, October to December 2024 | £8847 | £8337 |
The direction is consistent across sources even where the percentages differ: electricity carries the heavier policy load. That is the mechanism behind proposals to rebalance levies, which would move some of the cost from electricity to gas and narrow the ratio10. For the full breakdown of what sits on a bill, see policy costs and levies.
Cheaper per kWh, but not always cheaper overall: when electricity wins
There are cases where the higher unit rate does not make electricity the more expensive option. The clearest is a home with no gas connection at all, where the comparison is not between two fuels but between electricity and whatever alternative is available. For a household already paying a gas standing charge, the marginal cost of gas heat is the unit rate alone, which is why the four-to-one gap bites hardest in homes that heat with gas.
Electricity wins on efficiency in specific applications. Electric heaters turn all the electricity they use into heat, so a kilowatt hour of electricity delivers a full kilowatt hour of heat, while a gas boiler delivers less than the energy content of the fuel it burns2. Where the heat demand is small and intermittent, that efficiency advantage can matter more than the unit rate.
Electricity also wins where the alternative is not gas but a more expensive fuel, and where a household can shift consumption to a cheaper time of use tariff. The cap does not apply to time of use tariffs, so those rates are set by the contract rather than by Ofgem's quarterly level6. For a household weighing a time of use tariff against the cap, see tracker and time of use tariffs.
The honest summary is that gas is cheaper per kWh by a wide and persistent margin, and that this margin survives boiler efficiency losses. Electricity can still be the right choice for a specific job, a specific home or a specific tariff, but not because the unit rate comparison has been overturned. For how the two fuels fit into a household's wider exposure to the grid and to suppliers, see energy bills and energy independence.
Sources17 cited
- Average gas and electricity bills in the UK, Uswitch, 2026
- Electric central heating, Which?, 2024
- Delivering net zero for Scotland's buildings, Scottish Government, 2026
- Energy price cap, Ofgem, 2026
- Energy standing charges, Uswitch, 2026
- Energy price cap explained, Welsh Government, 2026
- Household energy bills green levies, Nesta, 2024
- Electric wallpaper explained, Energy Saving Trust, 2026
- Turning up the heat, Resolution Foundation, 2025
- Scenario 2: cheaper electricity, Nesta, 2024
- Green costs on energy bills 101, Carbon Brief, 2026
- Energy price caps information leaflet, Ofgem, 2018
- Energy price cap, House of Commons Library, 2026
- Energy Price Guarantee announcement, GOV.UK, 2022
- Consumer advice: problems with services, Isle of Anglesey County Council, 2025
- Energy price cap will rise 2 per cent in October, Ofgem, 2025
- Tackling fuel poverty in Scotland, Scottish Government, 2025
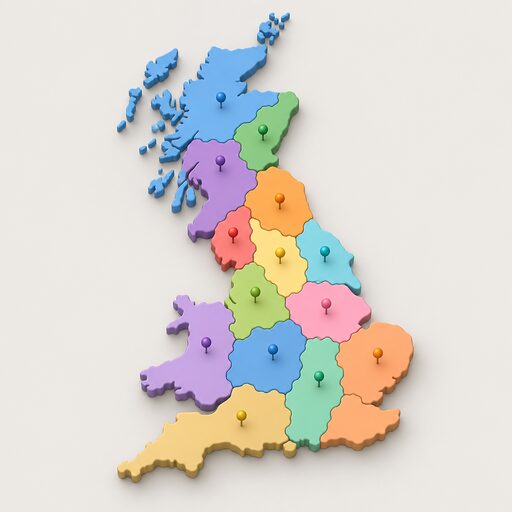 Unit Rates by RegionWhy do electricity and gas prices differ depending on where you live?
 Energy Price CapThe price cap sets the most you pay for each unit of gas and electricity, plus the daily standing charge, but not your total bill.
 Heat Pump Running CostsWhat does a heat pump cost to run each year, and is it cheaper than a gas boiler?
 UK Energy Prices vs EuropeWhy does the UK pay so much for electricity when our gas is cheaper than most of Europe?
 Ways to Pay an Energy SupplierHow you pay for gas and electricity changes what you are charged, and by how much.
 Reducing Your BillRanks household electricity and gas uses by share of the bill and sets out what each measure changes, from heating settings and insulation to appliance use and tariff choice.