In this guide
A home battery monitoring app is the window a household gets onto a system it has paid several thousand pounds for. It shows what the battery is doing, what the house is using, what is being drawn from or pushed to the grid, and whether the charging plan is running as intended. What it does not do is give the household ownership of that data. Almost every manufacturer app is a cloud service: the readings travel from the battery to a server, and the app reads them back. If the internet or the manufacturer's platform is unavailable, the app goes quiet even though the battery keeps working.
The figures behind those screens come from metering hardware, and the quality of that hardware sets the quality of the picture. A smart meter in-home display updates electricity every 10 seconds and gas every half an hour1. Octopus Energy's Home Mini updates a customer's app and online account every 5 to 15 seconds2. A Shelly Pro 3EM-120A stores data in non-volatile memory that can be retrieved for a period of up to 60 days in 1-minute intervals3. Those are very different resolutions, and they explain most of the disagreements a household sees between one screen and another.
For energy independence, monitoring sits in an awkward place. It does not generate or store anything, and it usually adds a cloud dependency to a system that would otherwise run on its own. What it does give is the evidence needed to check that a battery is doing what it was sold to do, and the local-access route is what determines whether that evidence survives the loss of a broadband connection or a manufacturer's platform.
What a monitoring app shows, and why it matters for independence
A home energy monitor is usually bought separately and mainly tracks electricity use in the home, while a smart meter's in-home display shows gas and electricity use and its cost in real time1. That distinction matters when a household is trying to work out whether a battery is earning its keep, because the two devices answer different questions. The in-home display tells you what the house is consuming. The battery app tells you what the battery did about it.
The independence question is not whether the app is pleasant to use, but what happens when it stops. A battery that is managed entirely in the cloud depends on a manufacturer's servers, a broadband connection and an account that continues to exist. A battery with local management continues to protect itself regardless. GivEnergy states that the built in local management capabilities of your system will continue to monitor battery cells and shut down if there is an issue7. That is the safety layer working without the cloud, and it is the part that matters most.
Beyond safety, monitoring is what turns a battery from a black box into a measurable asset. Domestic battery storage has a shorter lifetime of around 10 to 15 years, when compared to solar panels4, and a household that cannot see throughput, state of charge and cycling behaviour has no way to judge whether the system is on track for that life or heading for an early warranty claim. The app is also where tariff behaviour becomes visible: charging during off-peak hours at the lowest rate and using the energy during the peak-rate period is the standard pattern, with peak hours typically 4pm to 8pm8.
What monitoring does not change is the underlying dependence. A cloud app adds a supplier relationship on top of the electricity supplier relationship. The household still draws from the grid when the battery is empty, still relies on the manufacturer for firmware and platform access, and still relies on the installer for anything physical. Monitoring makes that dependence visible; it does not remove it.
Manufacturer apps: Sungrow iSolarCloud, Solplanet and Moixa
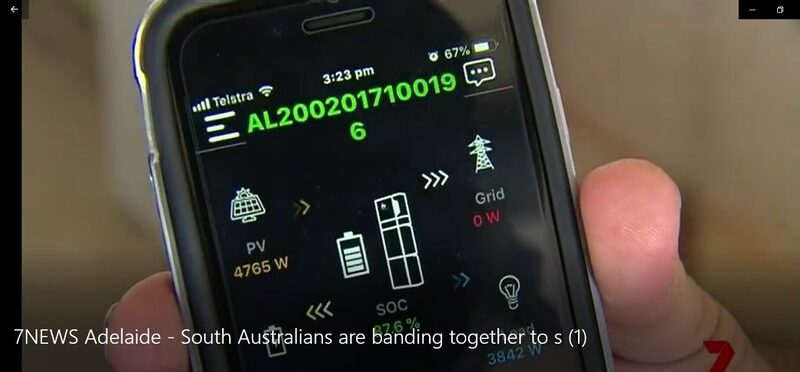
The three platforms a UK household is most likely to meet in this category differ in scope. Sungrow's iSolarCloud is an integrated operating and monitoring system intended to operate and maintain photovoltaic and energy storage plants, and the major Sungrow products supporting it are its photovoltaic inverters and energy storage systems9. It is built as a plant-management tool, which means it carries more configuration and reporting than a purely domestic app, and it assumes the installer as a primary user.
The Solplanet App is aimed at both ends of that split. It is described as ideal for installers and end users, offers quick and easy commissioning and configuration, reports live data through the Solplanet Cloud, compares power generation across different timeframes including daily power yields, and sends real-time fault notifications and troubleshooting information10. It supports multiple users with assignable management permissions, and gives in-app access to the service department for warranty or technical support10. It is downloadable from the App Store and from Google Play10. The related hardware includes the Ai-Logger 2000, Ai-AMU 2000, Ai-Logger 1000 and the Ai-Dongle10.
Moixa's platform is the oldest of the three in UK domestic use and the most limited in current support. The Moixa Dashboard is reached at mygridshare.com, and the help pages describing it date from 202211. Moixa's own support material is still the reference for how the dashboard behaves, but a household buying today should treat the platform's long-term availability as uncertain and check the current position before relying on it.
| Platform | Scope | Notable features | Source |
|---|---|---|---|
| Sungrow iSolarCloud | PV and storage plant operation and maintenance | Integrated operating and monitoring system | 9 |
| Solplanet App | Residential and installer use | Live data via Solplanet Cloud, timeframe comparison, fault notifications, multi-user permissions | 10 |
| Moixa Dashboard | Domestic battery and household energy | Battery, storage, household, grid and highlights sections | 11 |
The Moixa Dashboard: what each section tells you
The Moixa Dashboard is organised into named sections, and each answers a different question. The Storage Battery section shows current and historical data on the power flowing into and out of the battery, the level of charge, and any upcoming charging plan if one has been set11. The Storage section shows current and historical information and analytics on the battery's charging and discharging behaviour11. Together these two are the battery's own record.
The Household section shows current and historic information and analytics on household energy consumption, including a comparison of the sources drawn from11. The Grid section shows current and historical information and analytics on the house's use of grid energy including any power exported back to the grid11. The Highlights section shows the current and historical overviews of system performance and the energy tariff, if tariff details have been provided to the support team11.
That last condition is the one households trip over. The dashboard cannot show export earnings it has not been told about, and the tariff line depends on the household having supplied the details. The operating mode is changed on the Battery tab, at the bottom of the page, under Battery operation mode12. The smart mode predictions shown alongside it are based on solar generation and household consumption, not on the battery's behaviour12, which is worth knowing before reading anything into a forecast that looks wrong.
For a household whose battery is a Moixa unit, the dashboard remains the only first-party view of the system. It is a cloud service, so it depends on the platform continuing to run. The battery's own local management is the layer that keeps working if it does not.
Getting the data right: time zones, connections and refresh rates
Most apparent faults in battery monitoring are timing faults. Supplier apps and online accounts often present half-hourly graphs at a day's delay2, while an in-home display updates electricity every 10 seconds and gas every half an hour1. A dashboard reading a battery's own telemetry may update faster still. Put those three side by side and the totals will not match at any given moment, even when all three are correct.
The second cause is the boundary of what is measured. A battery app measures at the inverter or the battery terminals. A whole-home monitor measures at the meter tails. A smart meter measures at the meter. Losses between those points are real, and they are the reason a battery's own figure for energy discharged will exceed what the house actually received. Round-trip losses and standby consumption sit in that gap, and they are covered in more detail on round-trip efficiency.
The third cause is connection. A smart meter does not need wi-fi to work, but the apps and displays that read it usually do13. Where a household has changed supplier, plan details in an app can be wrong if the central database has not been updated since the switch, and those details can be corrected in the Settings section of the app14. Where a meter has been mixed up between flats in the same building, residents can be charged for the wrong flat's usage, and meter serial numbers should be checked with the current supplier before switching15.
Local access and third-party meters: Shelly Pro 3EM and Victron
Local monitoring exists to remove the cloud from the loop. The Shelly Pro 3EM-120A is a DIN-rail meter that measures at the installation itself and keeps its own record. It is photovoltaic ready3, measures active and apparent power, active and apparent energy, power factor, and fundamental active and fundamental reactive energy3, and gives optical pulse indication of energy usage3. It runs on an ESP32-D0WDQ6 processor with 16 MB of flash and supports mJS scripting3, which is the mechanism by which readings are pushed to a local system or a third-party platform rather than only to a vendor cloud.
Victron takes the opposite approach, building the monitoring into a wider off-grid ecosystem. Managed batteries can be integrated through Victron's GX devices in minutes, and AC-PV inverters are supported directly after installing a software assistant17. With the VictronConnect app and the VRM portal, a household can monitor the complete system, change settings and catch potential issues early through alerts and alarms17. The VRM portal is itself a cloud service, so the local advantage comes from the GX device and the app rather than from the portal.
Third-party monitors are not automatically better. Some third-party home energy monitors may offer more detailed electricity insights, depending on the system1, and some wireless energy monitoring devices may also require subscription apps or additional accessories depending on the manufacturer1. A household adding one is adding a second data path, not replacing the first.
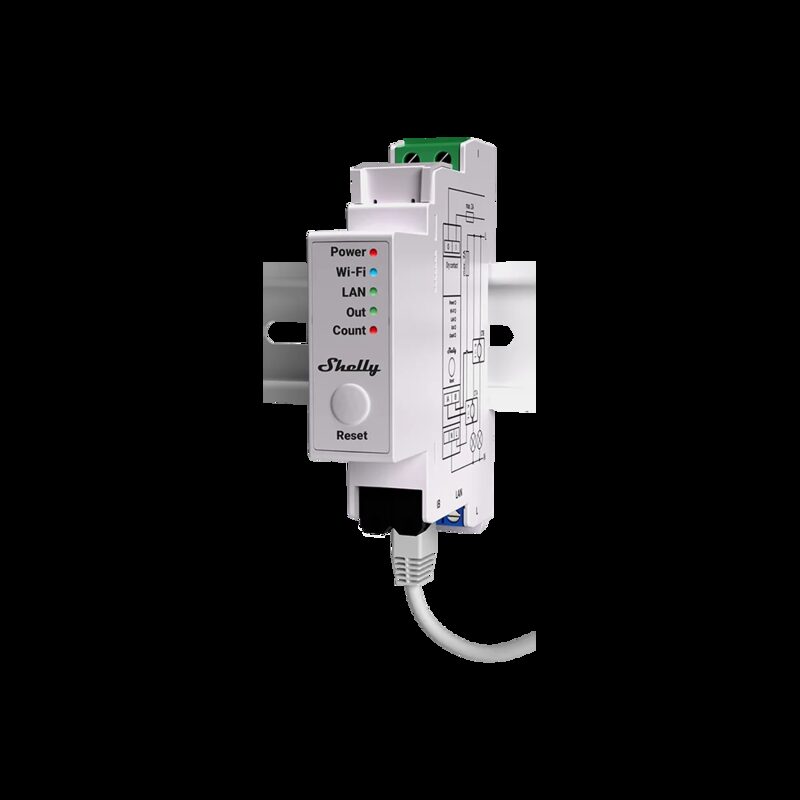
Shelly Pro 3EM-120A specifications: accuracy, data storage and connectivity
The specification table below is drawn from the maker's product page and describes the 120A variant. It is the level of detail worth checking before buying any monitoring hardware, because the storage period and the scripting support determine whether the device can stand alone.
| Specification | Value | Source |
|---|---|---|
| Data storage | Non-volatile memory, retrievable for up to 60 days at 1-minute intervals | 3 |
| Measured quantities | Active and apparent power, active and apparent energy, power factor, fundamental active and reactive energy | 3 |
| Scripting | mJS | 3 |
| CPU | ESP32-D0WDQ6 | 3 |
| Flash memory | 16 MB | 3 |
| Power consumption | Less than 3 W | 3 |
| Pulse indication | Optical pulse indication of energy usage | 3 |
| Solar readiness | Photovoltaic ready | 3 |
| Reviews | Based on 1 review, 100% positive | 3 |
The 60-day window is the figure that matters most in practice. It means the device holds a rolling record that survives a network outage, but it is not an archive. Anything older than 60 days has to have been exported or scraped by another system, which is where the mJS scripting support earns its place. The power consumption figure of less than 3 W is small but not zero, and it sits on the household's own side of the meter.
The review count is a single review, so it carries no statistical weight and should not be read as a quality signal either way. The measured quantities list is the more useful indicator: power factor and reactive energy measurement mean the device can distinguish real from apparent power, which matters on a supply with large inductive loads or a solar inverter exporting.
Cloud versus local monitoring: which route fits which home
The choice is not between good and bad monitoring, but between two dependency profiles. A cloud app is easier to live with: it works from anywhere, it is updated by the manufacturer, it usually comes free with the system, and it needs no configuration beyond a login. Its weakness is that it depends on a server, a broadband connection and a company that continues to operate the platform. Moixa's dashboard is the clearest illustration in this category, since its help documentation dates from 2022 and its long-term support is not something a buyer can assume.
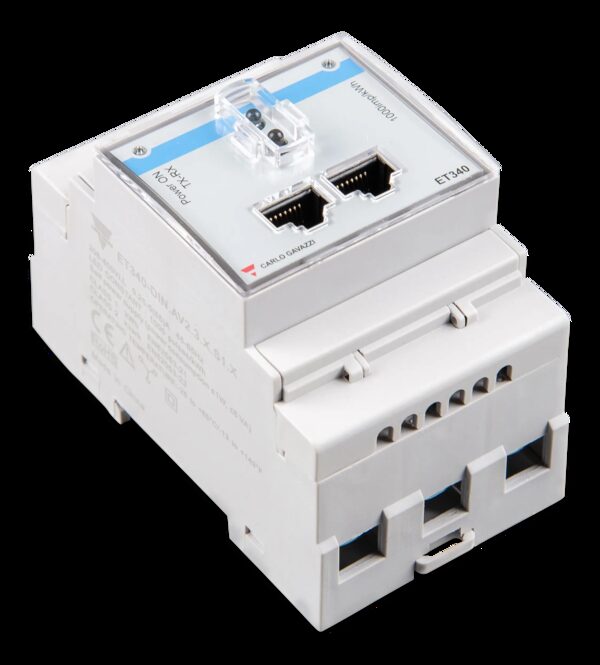
A local route is harder to set up and narrower in reach. It typically means a meter on the DIN rail, a scripting or integration layer, and a household willing to maintain it. In exchange, the data stays in the building, the record survives a broadband outage, and the monitoring does not stop if a manufacturer withdraws a platform. The safety layer is separate from this: GivEnergy's built in local management capabilities will continue to monitor battery cells and shut down if there is an issue7, and that applies whether or not any app is reachable.
For most homes the practical answer is both, with different jobs. The manufacturer app is the day-to-day view and the warranty and support channel. An independent meter is the record that outlives the app. Households that want the wider picture of what a battery contributes to self-sufficiency should read how much self-sufficiency a solar and battery system can achieve, and those weighing whether the system pays at all should read how battery savings and payback are worked out.
When the dashboard disagrees with your meter
Disagreement between a dashboard and a meter is normal, and the causes are worth working through in order before assuming a fault. The first is resolution: an in-home display cannot record information, it simply displays data from the smart meter18, so it is not a reference. The second is delay: readings on an in-home display usually take a bit longer to update than the ones on the meters, and this delay is normal16. The third is scope, since a battery app and a whole-home monitor are measuring at different points.
Where the disagreement is large and persistent, the meter itself is worth checking. A meter running backwards can lead to inaccurate energy billing and a corrected bill later, and where a household has solar PV the installer should check the meter is fit for purpose and inform the supplier if it needs upgrading19. Meter board problems are a separate matter: customers typically need a replacement when the meter board is damaged or rotten, when there is damp or risk of asbestos, when it is damaged or coming away from the wall, or when the supplier is unable to change the electricity meter20.
If a billing dispute follows, the ombudsman's case studies show what tends to go wrong. In one disputed usage case the finding was that there had been a delay in the supplier updating its systems and it had failed to identify the issue when the complaint was raised21. Keeping an independent record is the practical defence, and it is the strongest argument for local monitoring hardware.
Cost of adding independent monitoring hardware
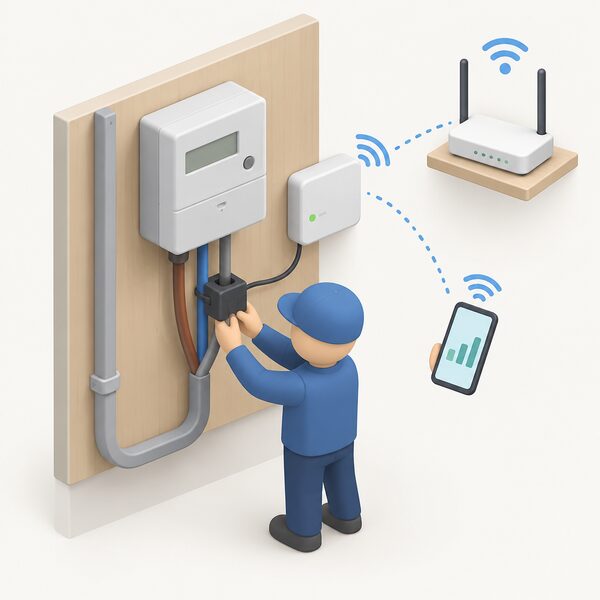
Monitoring hardware is a small line item against the battery itself. Domestic battery storage costs up to £10,000 depending on size, with a typical 5kWh system around £4,6004, and the up-front cost of installing a battery can be up to £2,544 more23. Against those figures, a whole-home energy monitor at more than £60, which requires a wi-fi connection and a smartphone to operate5, is marginal.
The comparison that matters is with what the household already has. A smart meter installation is at no extra cost to you6, and the supplier will also offer an in-home display, also at no extra cost, to help track energy usage24. Those two cover the basics of consumption monitoring without any purchase. What they do not cover is battery-level detail, export measurement at the installation, or a record that survives a change of platform.
Some wireless energy monitoring devices may also require subscription apps or additional accessories depending on the manufacturer1, so the purchase price is not always the whole cost. On the Victron side, two figures for the BMV-702 are in circulation: £95.83 plus VAT from one distributor, and £115 with no VAT from another, outside the UK. Both figures are given because the conflict is unresolved, and a household buying Victron monitoring should confirm the current UK price and VAT position with the seller.
For context on where monitoring sits in the wider system, the full guide to home battery storage covers sizing, installation and the standards that apply, and Victron systems for off-grid and home battery use covers the monitoring ecosystem in more depth.
Sources24 cited
- Smart meters vs home energy monitors, Smart Energy GB, 2026-08-17
- How to use your smart meter data, Which?, 2026-07-14
- Shelly Pro 3EM-120A, Zendure, 2026-09-19
- Battery storage, Centre for Sustainable Energy, 2026-06-25
- Are energy monitors the best way to measure your power usage, Which?, 2026-03-31
- How to get a smart meter, Smart Energy GB, 2026-08-03
- GivEnergy FAQs, Energy Storage Association UK, 2026-04-17
- The best heating for your home, Which?, 2025-10
- Top 3 reasons to choose Sungrow iSolarCloud, Sungrow, 2024-12-06
- Solplanet App, Solplanet, 2026-08-19
- Moixa Dashboard walkthrough, Moixa, 2022-02-21
- Switching operation mode, Moixa, 2022-02-22
- Does a smart meter need wi-fi?, Smart DCC, 2026
- Smart meter connection, Uswitch, 2026-09-19
- Moving house gas and electricity guide, Uswitch, 2026-08-26
- Fixing problems with your smart meter in-home display, Citizens Advice, 2026-09-17
- Off-grid systems, Victron Energy, 2026
- Data access and privacy, Smart Energy GB, 2026-03-16
- Solar panel problems and how to solve them, Which?, 2026-03-26
- Replace meter board, UK Power Networks, 2026-09-17
- Billing case studies, Energy Ombudsman, 2026-09-20
- Consumer success stories, Renewable Energy Consumer Code, 2026-09-17
- Solar panel installation, maintenance and repair, NICEIC, 2026-09-17
- Smart meter costs: are smart meters free?, Smart Energy GB, 2026-03-16
 Solar and Battery MonitoringWhat does your solar and battery app actually show you, and can you trust it?
 Local Control vs the CloudCan your solar, battery or charger still work if the maker's app or servers disappear?
 Local Data Access and ModbusCan you read your own energy data at home without relying on a supplier's app?
 Charger Apps and ConnectivityHow a home charge point connects: Wi-Fi, Ethernet, 4G and Bluetooth, what the app controls, what happens when the network drops, and how much of the charger depends on the maker's cloud.
 App Subscriptions and CloudWill you have to pay a monthly fee for the app that comes with your heat pump, boiler or solar setup?
 Supplier Apps and AccountsWhat can you actually do in your supplier's app?