
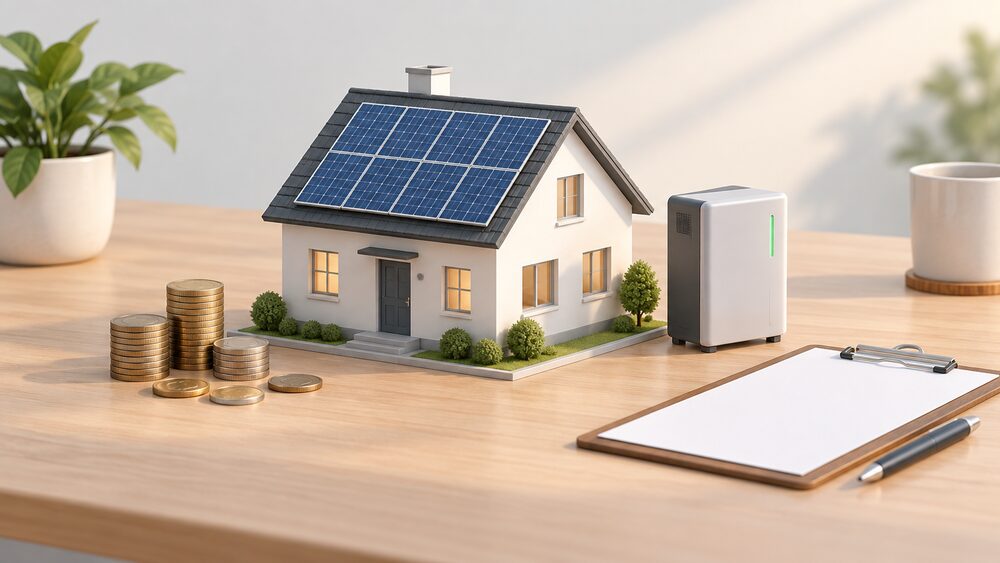
Solar in the UK is no longer a niche. Nearly 1.7 million installations sit on homes across the country, with around 19,000 households added every month1. That is still a small share of the housing stock: under 5% of the UK's 29 million homes have solar panels3. The gap between those two numbers is the whole story of this page, because the rate of uptake is not the same in England, Scotland, Wales and Northern Ireland, and the reasons differ as much as the figures do.
The headline comparison is that Scotland leads England on installations per household. Analysis of certification data indicates Scotland has higher installation rates than England for both solar PV and heat pumps on a per-household basis4. Wales has taken a different route, building capacity and local ownership rather than concentrating on rooftop counts, reaching 1.3 GW of solar PV across more than 86,000 projects by 20235. Northern Ireland's position is shaped by its housing stock and heating fuels rather than by a distinct microgeneration programme.
What follows sets out the figures, what drives them, how the four nations differ, the rules that govern installation, and what all of this does and does not do for a household's energy independence.
What are the figures?
The counts do not agree, and it is worth being straight about that. The most recent figure is nearly 1.7 million installations on homes across the UK, reported in August 20261. A June 2026 count puts it at more than 1.5 million homes8. A June 2026 press release states that 1.88 million households have domestic solar photovoltaic7. A September 2026 news report also gives nearly 1.7 million households9. Earlier in 2026, Solar Energy UK put the figure at around 1.6 million households10.
What is consistent is the direction and the pace. Around 19,000 households are added every month2. The historical series shows the same climb: 934,486 domestic solar panel installations in April 2018, 1,024,942 in April 2020, 1,067,693 in April 2021, 1,145,498 in April 2022 and 1,498,949 in April 202412.
| Date | Domestic solar panel installations in the UK |
|---|---|
| April 2018 | 934,48612 |
| April 2020 | 1,024,94212 |
| April 2021 | 1,067,69312 |
| April 2022 | 1,145,49812 |
| April 2024 | 1,498,94912 |
By the end of 2024 there were almost 1.5 million solar panel installations on homes across the UK13. A 2024 sustainability report put the share of UK households with solar panels at 5%14. An older figure, from 2014, described roughly one in every 43 UK homes having installed solar panels15, which shows how far the base has moved in a decade.
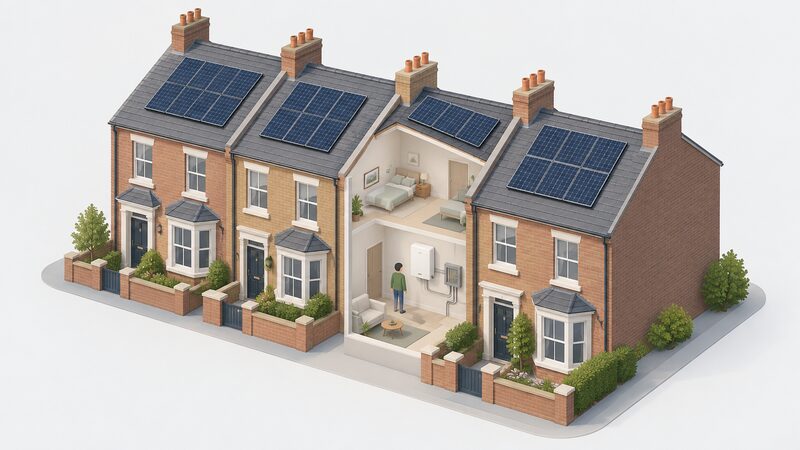
The typical domestic system is modest. Solar homes typically carry 3 to 5 kW of solar panels6. That matters for interpreting every other number on this page: the UK's total is built from a very large number of small installations, not a small number of large ones.
What drives uptake
Three forces show up repeatedly in the evidence: price, new build, and the presence of a battery.
Price is the clearest. Three million households planned to get solar panels within five years, with two fifths blaming energy price chaos16. A quarter of UK households, about seven million, want plug-in solar panels as the rules changed on 27 August 20262. Demand is being driven by bill anxiety rather than by environmental preference alone.
New build is the second force. More than four in ten new homes in England are built with solar power17. The UK Government is set to include requirements in its Future Homes Standard for most new builds in England to have solar panels13, and official policy is described as ensuring solar panels are fitted on new homes in England as standard18. That converts a discretionary purchase into a default specification, which is why the new build share runs so far ahead of the retrofit share.
Storage is the third. A self-consumption rate of 70% is reported for households with solar and a 10 kWh battery7. Without a battery, generation is exported at the moment it is produced, whether or not the household needs it. With one, it is shifted to evening demand. That changes the economics of a system more than a marginal increase in panel count does.
How does it differ across the UK nations?
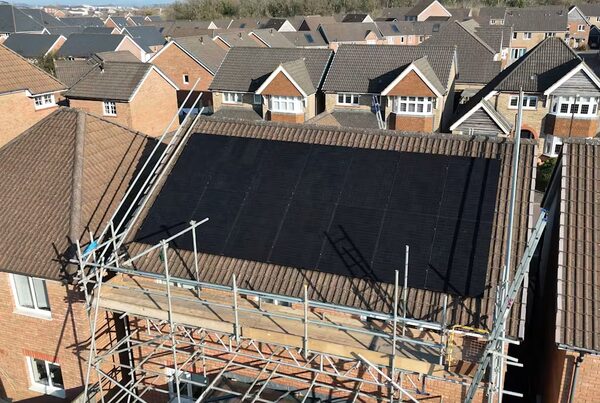
More than 1.4 million homes across the UK already use solar power, and the number continues to grow every year19. That national figure conceals four different pictures.
Scotland leads on the rate rather than the total. Analysis of certification data indicates Scotland has higher installation rates than England for both solar PV and heat pumps on a per-household basis4. The Scottish industry has pressed the Scottish Government to restore support for rooftop solar and batteries, which suggests the rate has been achieved despite, rather than because of, the support framework11.
England dominates on volume because it has the most homes, and it is pulling ahead on new build. More than four in ten new homes in England are built with solar power17, and the Future Homes Standard is set to require solar on most new builds13.
Wales has built capacity and local ownership. In 2024, 4.3 GW of renewable energy capacity was installed in Wales20. Solar PV reached 1.3 GW across more than 86,000 projects by 20235, up from over 1.1 GW across almost 64,000 projects in 202121. In 2023, 108 MW of new solar PV capacity was installed in Wales, with more than 15,300 new solar PV projects commissioned5. Of that new capacity, 69 MW was in installations under 10 kW, which is the domestic and small commercial end5.
Northern Ireland is the least visible in the figures available here. Its housing stock and heating fuels, rather than a distinct microgeneration programme, shape its position, and the wider picture is covered in home heating in Northern Ireland.
| Nation | What the figures show |
|---|---|
| Scotland | Higher solar PV and heat pump installation rates per household than England4 |
| England | More than four in ten new homes built with solar; Future Homes Standard to require solar on most new builds17 |
| Wales | 1.3 GW solar PV across more than 86,000 projects by 2023; 4.3 GW renewable capacity installed in 20245 |
| Northern Ireland | Position shaped by housing stock and heating fuels rather than a distinct microgeneration programme |
Which parts of Scotland have the most solar?
The available figures do not break Scotland down by council area, so a list of the best-performing Scottish regions cannot be given from the evidence here. What the data does show is the profile of an area with high solar potential. The criteria are a below average number of solar panel installations per 10,000 people against a UK median of 123, an above average percentage of homeowners against a UK median of 68%, a higher than average percentage of rural homes, and above average growth compared with 2025 against a UK median of 23%19.
That combination points to rural, owner-occupied areas with room to grow rather than to dense urban ones. The median number of solar panel installations per 10,000 people across UK local authorities is 12319. Scotland's per-household lead is a national figure, and the sub-national pattern within it is not resolved by the sources available.
Wales: capacity, ownership and targets
Wales is worth treating separately because its approach differs from the rest of the UK. The Welsh Government's target is to meet the equivalent of 100% of annual electricity consumption from renewable electricity by 2035, alongside at least 1.5 GW of renewable energy capacity locally owned by 2035, excluding heat pumps22. A written statement in March 2026 restated the 100% by 2035 goal20.
The progress figures are detailed. At the end of 2021 there was 3,508 MW of renewable electricity capacity in Wales, with 116 MW installed during that year21. Solar PV accounted for 97% of the renewable electricity capacity installed in 202121. Renewable electricity generation in Wales had increased by only 9% over the previous five years, compared with 140% in the preceding period21. In 2021, 70% of all renewable electricity generation in Wales came from onshore and offshore wind21.
By the end of 2023, total renewable electricity capacity in Wales was 3,663 MW, with 869 MW of renewable heat capacity5. In 2023, 176 MW of renewable energy capacity was installed, comprising both electrical and heat capacity5. Local ownership stood at 0.9 GW, which the Welsh Government describes as 60% of the way towards its new target as of 20235. At the end of 2024, local ownership had reached 0.99 GW20.
The domestic share matters for this page. In 2021, Wales had around 56,200 domestic solar PV projects and over 10,500 domestic heat pumps21. Domestic locally owned renewable energy accounted for 70,575 projects and 209 MWe21. The growth in Welsh renewable capacity has been primarily led by solar PV and heat pump installations24.
"increased capacity primarily led by solar PV and heat pump installations"
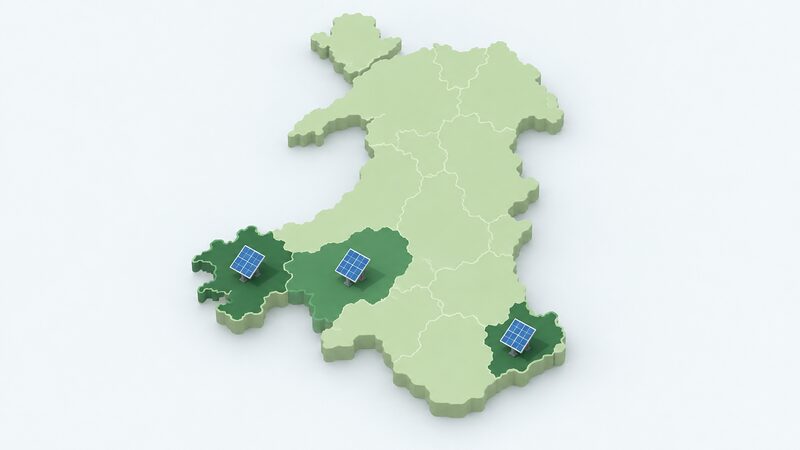
The geographic concentration is notable. Pembrokeshire had 199 MW of solar PV capacity, Carmarthenshire 111 MW and Newport 101 MW21. Those are the largest single concentrations, and they reflect larger-scale projects rather than rooftop arrays. For a household, the relevant point is that Wales has built a substantial renewable base, but the domestic rooftop share of it is a minority of the total.
What are the rules?
The planning position differs by nation, and it is the main regulatory variable a household faces.
In England, the direction of travel is towards solar as standard on new build. The Future Homes Standard is set to include requirements for most new builds in England to have solar panels13, and official policy describes ensuring solar panels are fitted on new homes in England as standard18. For existing homes, domestic solar generally falls under permitted development, subject to conditions on listed buildings, conservation areas and flats.
In Scotland, the Scottish Government consulted on permitted development rights for non-domestic solar panels and domestic air source heat pumps25. The consultation followed the UK Government's 2014 solar strategy, which sought to increase non-domestic permitted development rights for non-domestic solar panels, proposing a capacity limit of 1 megawatt instead of 45 kW25. The detail of the Scottish regime is set out in planning rules for home energy equipment in Scotland.
In Wales, the Welsh Government publishes guidance on solar panels as a green energy choice26, and the planning regime is covered in planning rules for home energy equipment in Wales. In Northern Ireland, the equivalent is planning rules for home energy equipment in Northern Ireland.
The rules matter for uptake because they determine whether an installation is a straightforward purchase or a months-long consent process. Where permitted development applies, the decision is commercial. Where it does not, the friction is enough to stop many households.
What it means for energy independence
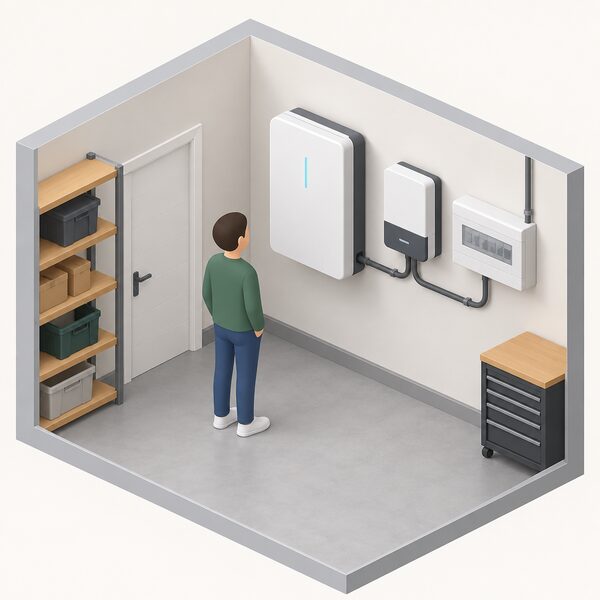
Microgeneration changes a household's relationship with the grid, but it does not end it. The gains are real and measurable. During a heatwave week, the average home with solar generated 15.2 kWh of electricity a day7. Households sold 4.6 kWh of electricity back to the grid per day, earning 55p7.
The bill effect depends on usage. An average-usage household with seven panels and 2,700 kWh annual consumption saved £17.44 on its bill and earned £3.83 from exports, a total of £21.27 over the seven days7. A high-usage household with ten panels and 4,100 kWh annual consumption saved £24.47 and earned £5.37, a total of £29.847. These are heatwave-period figures and should not be read as annual savings.
| Household | Panels | Annual consumption | Bill saving | Export earnings | Total |
|---|---|---|---|---|---|
| Average usage | Seven | 2,700 kWh | £17.44 | £3.83 | £21.277 |
| High usage | Ten | 4,100 kWh | £24.47 | £5.37 | £29.847 |
At national scale, the UK has established itself as one of the leaders in installed solar photovoltaic capacity per land area among advanced economies, and solar is credited with reducing dependence on fossil fuel imports27. That is the sovereignty argument in one line: generation at home substitutes for energy bought from abroad.
The dependence that remains is worth stating as firmly as the benefit. A solar home still relies on the grid for balancing and for export, on a supplier for payments, and on a manufacturer for warranty and spares. A battery reduces reliance on the grid at peak times but adds a component that can fail. The self-consumption rate of 70% with a 10 kWh battery7 means that even with storage, roughly three tenths of generation is not consumed on site. Independence is partial, and it is conditional on equipment that a household does not control.
There is also a market signal in the other direction. Solar panels are associated with higher home values28, which means the investment is partly recoverable on sale. That does not make it a financial product, and no recommendation follows from it, but it does mean the cost is not entirely sunk.
Where the evidence is thin
Two gaps are worth naming. First, the UK totals disagree. Over 1.5 million homes8 and over 1.3 million homes generating electricity from solar panels29 are both in circulation, and the two figures are not reconciled. The newer and higher figures are more likely to reflect the current position, but the range should be treated as genuine uncertainty rather than as a rounding difference.
Second, the sub-national picture is uneven. Wales publishes detailed capacity and project data by year21. Scotland's lead is established at national level4 but not broken down by region in the figures available. Northern Ireland's microgeneration position is not captured in the same way. A household trying to judge how common solar is in its own area will find the UK median of 123 installations per 10,000 people19 more useful than a national total, but even that is a median across local authorities rather than a local figure.
The wider context, including how the four nations differ on grants, fuel poverty and housing stock, is set out in home energy across the UK nations. For the household-level question of whether renewables suit a particular home, the considerations are covered in are home renewables right for you and in the battery economics in is a home battery worth it.
Sources29 cited
- Solar power facts, Energy Saving Trust, 2026-08-13
- Plug and play: 7 million want plug-in balcony solar as law changes on 27 August, Uswitch, 2026-08
- Solar Wizard calculator, Centre for Sustainable Energy, 2026-05-06
- Uptake of net zero technologies in Scottish homes, Energy and Climate Intelligence Unit, 2026-06-22
- Energy generation in Wales 2023, Welsh Government, 2023
- 2026 set for record solar power take-up, Solar Energy UK, 2026-09-14
- Here comes the sums: Britain's homes with solar panels reap £40 million during the heatwave, Uswitch, 2026-06-28
- Solar panel myths: five common concerns about solar PV debunked, Which?, 2026-06-09
- Analysis: UK solar power hits record high over summer 2026, Carbon Brief, 2026-09-04
- As UK government pushes solar, Scottish industry calls on Scottish Government to restore support for rooftop solar and batteries, Solar Energy UK, 2026-01-21
- Solar sector ready and able to deliver government's Warm Homes Plan, Solar Energy UK, 2026-01-20
- Green home statistics, Uswitch, 2024-04
- Buying a house with solar panels, Energy Saving Trust, 2024
- Which?'s annual sustainability report series 2024: home insulation and heating, Which?, 2024-11-07
- Five things we learned from DECC's annual energy statement, Carbon Brief, 2014-11-07
- Sunbelievable: three million households plan to get solar panels in the next five years, Uswitch, 2026-05
- Solar spearheads response to energy crisis, Solar Energy UK, 2026-03-23
- Britain continues to break clean power records, GOV.UK, 2026-05-28
- UK solar panel hotspots, Energy Saving Trust, 2026
- Publication of energy generation and energy use in Wales: first combined edition report, Welsh Government, 2026-03-18
- Energy generation in Wales 2021, Welsh Government, 2022-10
- Renewable energy deep dive: biannual recommendations update, Welsh Government, 2035
- Publication of summary of responses: consultation on Wales renewable energy targets, Welsh Government, 2035
- Publication of energy generation in Wales 2021, Welsh Government, 2021
- Permitted development rights for non-domestic solar panels and domestic air source heat pumps, Scottish Government, 2015-06
- Solar panels, Welsh Government
- The UK's clean energy leadership: insights from the World Energy Outlook 2024, Solar Energy UK, 2024
- Do solar panels increase home value?, The CPA, 2026-01-20
- Generating renewable electricity, Energy Saving Trust, 2025-12-11
 Home Energy Planning WalesSolar panels and heat pumps often need no planning permission in Wales, but the rules differ from England.
 Energy Supply in ScotlandScotland makes far more low-carbon electricity than it uses and sends the rest south.
 Devolution and Energy PowersLiving in Scotland, Wales or Northern Ireland can mean different grants and building rules for your home than in England.
 Housing Stock Data for NIMost homes in Northern Ireland heat with oil, so why are the grants and help different from the rest of the UK?
 Renewable Generation by NationHow much of our electricity comes from renewables, and why do the figures keep changing?
 EV Charging SupportHow easy is it to charge an electric car near you in Scotland, Wales or Northern Ireland?