

In this answer
Short answer
Nearly 13 million homes in England carry an EPC rating of D or worse, according to the Resolution Foundation's August 2025 analysis of the government's Warm Homes Plan1. That is the single figure that matters most for this question, and it is a count of the housing stock rather than of certificates lodged.
The official statistics office frames the same problem differently. Of the social homes it examined in England and Wales, 28% have an EPC rating of D or worse2. The Energy Saving Trust puts over 15 million homes across Great Britain at an EPC rating of C or below3, and BEAMA reported more than 14.8 million UK homes at band D or below as of January 20264. The UK Green Building Council describes just under two-thirds of the nation's homes as rated D or below5.
The spread between these numbers is not a contradiction. It reflects different geographies (England, Great Britain, the UK), different thresholds (D or below, C or below) and, most importantly, the fact that EPCs cover around 71% of the housing stock in England and around 67% in Wales6. Every national total is therefore modelled from a partial dataset, and the true count of poorly rated homes is an estimate.
England, the UK and social housing: how the figures differ
The headline count for England sits at nearly 13 million homes rated D or worse1. Widen the boundary and the numbers grow: over 15 million homes across Great Britain are classed as energy inefficient at C or below3, and more than 14.8 million UK homes are rated band D or below4. The UK Green Building Council's "just under two-thirds" is a share rather than a count, and it is the highest of the three because it measures the proportion of the stock rather than a subset5.
Social housing performs better than the stock as a whole, and the gap is widening. Socially rented properties have the highest proportion of homes at band C or above, at 62.68% in England, compared with 53% of homes in England overall9. The social housing sector rose from 18% at C or above in 2008 to around 66%11, and over half of UK social housing was already at band C or better by October 202212. Less than a third, 28%, of socially rented homes fall below band C, against 52% of private rented homes13.
The private rented sector is the weak point. In England, 55% of rented households fall below EPC C14, and 1 in 2 private rented homes sits below the government's band C target13. Scotland has legislated separately for its private rented sector, and its social housing standard is set through the Energy Efficiency Standard for Social Housing rather than the English banding15.
Wales has its own profile: 63% of the Welsh housing stock was graded EPC Band D or below in 202217. Northern Ireland is covered by separate fuel poverty strategy work rather than the England and Wales certificate statistics18.

Why so many homes fall below Band C: age of the housing stock
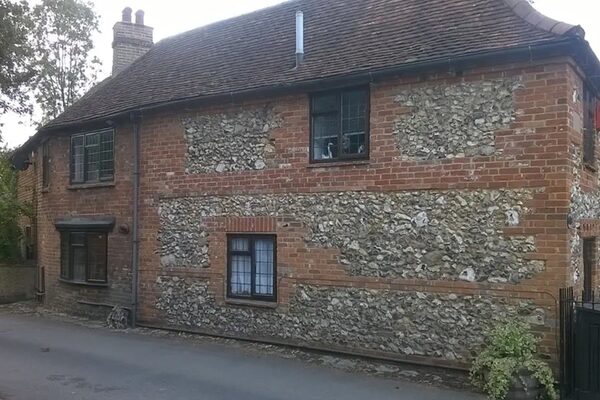
Age is the strongest single predictor of a poor rating. Over 80% of homes built before 1930 have an EPC rating of D or lower, and around half of those are rated band D19. The pre-1930 stock is roughly a century old, built before cavity walls, before insulation standards and before any regulation of thermal performance.
The geography follows the age of the stock. Tower Hamlets in London stands out as the local authority with the highest percentage of housing at band C or above, with 82% of dwellings holding a valid EPC score of 69 or above8. That is a newer, denser, flatted stock. The constituencies at the other end look very different: in Blackpool South, around 3 in 4 homes, 73%, are at EPC band D or below20.
There is also a measurement problem inside the data. A study of EPCs for 1.6 million dwellings that had at least two lodged certificates suggests that as many as 24% of homes that should be rated D are rated C21. In other words, some of the homes counted as compliant may not be, and the true number below band C is likely to be higher than the certificates show.
The volume of assessment itself moves with policy. In the first quarter of 2023, 352,000 existing domestic EPCs were lodged in England, an 8% decrease on the same quarter a year earlier22. Certificate numbers rise when a scheme or a sale requires one, which means the dataset is shaped by the rules as much as by the housing.
Grants and schemes that use an EPC of D or below as the threshold
Band D is the dividing line for most public funding. The schemes below all use it, in slightly different ways.
| Scheme | EPC threshold | Other conditions | Status |
|---|---|---|---|
| ECO4 | D, E, F or G for owner occupiers23 | Qualifying benefit; landlord permission if renting24 | Open |
| ECO4 improvement rule | D or E must be improvable to C24 | Applies to the property, not the household | Open |
| Home Upgrade Grant | D or lower, off the gas grid25 | Household income below £30,00026 | Closed to new applications |
| Warm Homes: Local Grant | D or below27 | England, privately owned, savings under £25,000, income usually £36,000 or less28 | Open |
| Warm Homes: Social Housing Fund | Below band C29 | Social housing stock | Allocated |
| New Warm Homes Programme (Wales) | E and below30 | Welsh dwellings | Policy stage |
ECO4 is the largest of these. If a householder owns their house, it must have an EPC rating of D, E, F or G to be eligible23, and the household must receive one or more qualifying benefits including Child Benefit, Pension Guarantee Credit, Income-related ESA, Income-based JSA, Income Support, Universal Credit, Housing Benefit and Pension Credit Savings Credit24. Homes at D or below can receive heavily discounted or free home insulation, green heating systems or an upgraded boiler23.
The Home Upgrade Grant targeted the worst performing households, those with an EPC rating of D or lower and no mains gas central heating in England25. It aimed to bring homes at F or G up to D, and homes at D or E up to C25, and it supported low energy efficiency, low income households with income below £30,000 across England26. Parliament's briefing on the scheme confirms it covered low income households in properties off the gas grid at bands D to G32. It has closed.
The Warm Homes: Local Grant is the current successor in England. It requires an EPC of D or below27, and covers owner occupied properties at band D, E, F or G and privately rented properties at band D or E28. Eligibility requires a home in England, privately owned, at EPC D to G, household savings under £25,000 and household income usually £36,000 a year or less, with postcode or benefits exceptions28. The Carbon Budget and Growth Delivery Plan factsheet describes it as providing energy performance measures and low carbon heating to low income households living in privately owned EPC band D to G homes in England2.
Wales runs its own programme. The New Warm Homes Programme sets its EPC eligibility at dwellings rated E and below30, a tighter threshold than England's D. Scotland's Warmer Homes Scotland scheme uses an EPC rating of D, E, F or G as its poor energy rating test18, and Scotland's private rented sector has its own minimum standards15.
What moving from D to C would take, and how many homes could get there
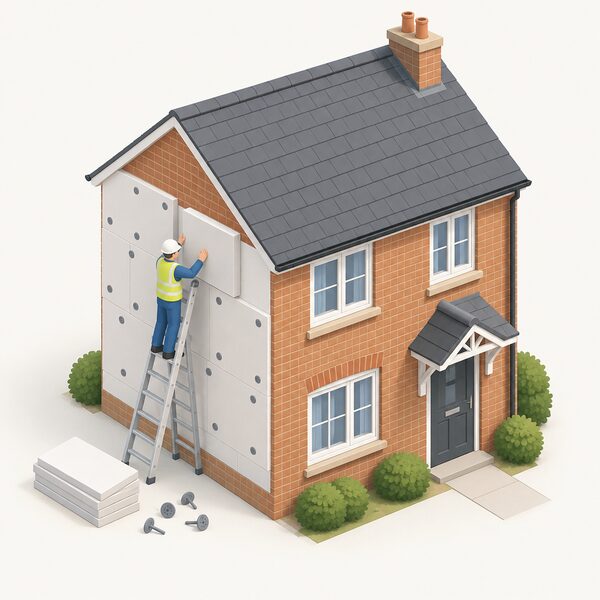
The cost of closing the gap is large. BEAMA put the figure at over £100 billion needed in the next 15 years to get homes in England up to EPC band C, as of 202133. That is a modelled estimate of the whole stock, not a per-home price, and it predates the current grant rounds.
For individual properties, the only official per-dwelling figure in the public record is older and narrower. A 2017 Scottish consultation estimated £203 million in total, or £2,140 on average, to raise dwellings with an initial EPC of E, F or G directly to EPC D15. That is a Scottish figure from 2017 and should be read as such, but it is the clearest published average for a band-to-band upgrade.
The same consultation modelled how many homes would need work at each stage. Between 26,000 and 36,000 dwellings would need upgrading in the first year of an EPC D requirement, depending on landlord behaviour15. At the backstop date, around 35,000 dwellings would still need work if F or G properties were only upgraded to E in the first stage, or 22,000 if all F or G properties were upgraded directly to D15.
What this means for a household's energy independence is straightforward. A home at band D or below is more exposed to price movements, because it needs more units of gas or electricity to reach the same internal temperature. The Energy and Climate Intelligence Unit found that families in poorly insulated homes could pay more on energy bills from April13. Insulation and glazing reduce that exposure permanently; a grant reduces the cost of getting there. Neither removes the grid connection or the supplier, and the certificate itself changes nothing about how the home performs until the measures are installed.
The scale of the task is also visible in the assessment market. EPCs cover around 71% of the housing stock in England and around 67% in Wales6, so roughly three in ten English homes have no certificate at all and are absent from every count on this page. For the wider dataset behind these figures, see EPC statistics and the UK home energy statistics pillar.
Sources33 cited
- The government's £13bn Warm Homes Plan must focus spending on bill-cutting measures, Resolution Foundation, 2025-08-07
- Carbon Budget and Growth Delivery Plan: heat and buildings factsheet, GOV.UK, 2026-06-23
- What the UK needs from the Warm Homes Plan, Energy Saving Trust, 2025-04-17
- Warm Homes Plan: a major step forward for heat electrification, BEAMA, 2026-01-05
- Home retrofit, UK Green Building Council, 2026-09-20
- Energy performance of buildings certificates statistical release, January to March 2026, GOV.UK, 2026
- Energy performance certificates, Uswitch, 2026-07-27
- Energy efficiency of housing in England and Wales, Office for National Statistics, 2025-03
- Energy saving statistics, Uswitch, 2024
- Balancing investment in clean heat and energy efficiency in Scottish housing retrofit, ClimateXChange, 2024
- £1.5 billion to improve energy efficiency and slash bills, GOV.UK, 2022-09-29
- The domestic retrofit challenge, CIBSE, 2022-10
- Families in poorly insulated homes could pay £700 more on energy bills from April, Energy and Climate Intelligence Unit, 2025-03-25
- Understanding barriers to heat pump uptake in the private rental sector, Nesta, 2025-11-11
- Minimum standards for energy efficiency in the private rented sector, Scottish Government
- Energy Efficiency Standard for Social Housing guidance, Scottish Government, 2020-11
- Energy use in Wales report, Welsh Government, 2022
- NI fuel poverty strategy, Energy Saving Trust, 2025-07-03
- How to make a Victorian house more energy efficient, Uswitch, 2025-09-25
- Blackpool South households gripped by fuel poverty, Energy and Climate Intelligence Unit, 2024-04-30
- Reforming EPCs to support households in the energy transition, Which?, 2024-04-29
- Energy performance of buildings certificates statistical release, January to March 2023, GOV.UK, 2023
- ECO4, Elmhurst Energy, 2026-09-20
- Energy Company Obligation ECO4 scheme, Derbyshire County Council, 2025-09-25
- Home Upgrade Grant, Elmhurst Energy, 2026-09-20
- Green Homes Grant Local Authority Delivery and Home Upgrade Grant statistics, November 2025, GOV.UK, 2025-11
- Wolverhampton Warm Homes Local Grant, Act on Energy, 2026-09-16
- Warm Homes: Local Grant, Greater Manchester Combined Authority, 2026-09-17
- Warm Homes: Social Housing Fund Wave 3 budget allocation, GOV.UK, 2024-11-21
- New Warm Homes Programme policy statement, Welsh Government, 2023-06-15
- Green Homes Grant Local Authority Delivery and Home Upgrade Grant statistics, March 2025, GOV.UK, 2025-03-27
- Energy efficiency of the private rented sector, House of Commons Library, 2026-09-17
- Net Zero by Design: our vision of a zero carbon home, BEAMA, 2021
 Housing Stock Data for EnglandHow energy efficient are English homes, and how many have insulation or low carbon heating?
 Efficiency of UK HomesMost UK homes now score better on energy than they did a decade ago, but older houses still lag well behind new builds.
 EPC StatisticsHow energy efficient are UK homes, and is it getting better?
 Housing Stock and EPCsNorthern Ireland's homes score best in the UK for energy efficiency, yet most run on heating oil.
 The Full Statistics GuideHow many homes in the UK have solar panels, heat pumps or batteries?
 Housing Stock Data for NIMost homes in Northern Ireland heat with oil, so why are the grants and help different from the rest of the UK?