
In this guide
The UK public charging network reached 121,171 public EV chargers as of 1 July 2026, with 174.9 chargers per 100,000 of the population and 28,887 of those rated rapid or above at 50kW and higher1. That is a national average of one public charger for every 17 battery electric vehicles as of 1 April 20261. Independent tracking puts the total at 123,677 chargers at the end of August 2026, across 47,810 charging locations2.
For a household without a driveway, public charging is not a backup. It is the whole charging plan, and it carries costs and constraints that a home charge point does not. Public charging is more expensive than charging at home, the payment methods vary by network, and the density of chargers varies sharply between the four nations4.
This page sets out what the network contains, what each type of site is for, what it costs, how payment works, what the safety rules require, and where public charging leaves a household still dependent on infrastructure it does not control.
How many public chargers the UK has, and where they are
The official count of 121,171 public EV chargers at 1 July 2026 includes 5,119 added to the network so far that year, against 13,281 added across the whole of 20251. Independent statistics put the total at 123,677 chargers at the end of August 2026, across 47,810 charging locations, with 1,069 charging hubs open to all EVs2. The two figures differ because they are compiled on different dates and by different methods; the official series is released under the official statistics in development label1.
Location matters more than the headline number. Of the official total, 52% were classed as destination chargers, 33% as on-street, 11% as en route and 4% as other1. In England and Wales, 83.3% of public EV chargers were located in urban areas, compared with 82.4% of the population living there, and 16.7% were in rural areas against 17.5% of the population1. The network broadly follows where people live, which is not the same as following where charging need is greatest.
Growth has been concentrated outside the capital. In the 24 months to the end of April 2026, 23,639 charge points or charging devices were added outside London including standard units, and 73 per cent of all-device additions fell outside London over April 2024 to April 20266. Of rapid and ultra-rapid charge points specifically, over nine in 10 built in the previous two years were outside London6.
Charger types and power bands: 3kW to 150kW and above
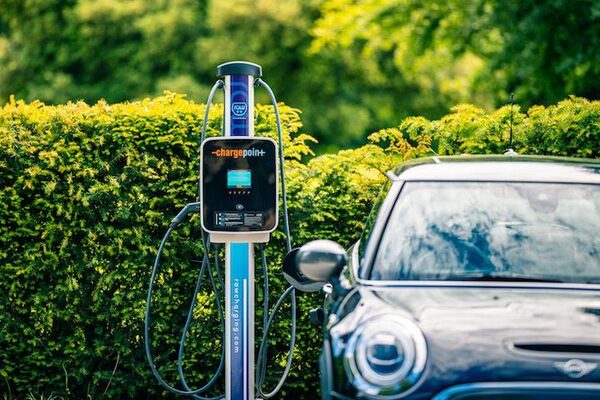
Public chargepoints are grouped by power output, and the banding determines what the unit is good for. Official statistics use four bands: 3kW up to 8kW, 8kW to 49kW, 50kW to 149kW and 150kW and above7. Independent statistics use a parallel set of names: Standard from 3kW up to 7.9kW, Standard Plus from 8kW up to 49kW, Rapid from 50kW up to 149kW, and Ultra-rapid at 150kW and above3.
| Band | Power range | Share of UK chargers, 1 July 2026 | What it suits |
|---|---|---|---|
| Standard | 3kW to less than 8kW | 49%1 | Long dwell, overnight or all-day parking |
| Standard Plus | 8kW to 49kW | Not stated in the official banding | Workplace and destination stops of a few hours |
| Rapid | 50kW to less than 150kW | 12%1 | A journey top-up of 30 to 60 minutes |
| Ultra-rapid | 150kW and above | Not stated in the official banding | Short stops on long routes |
The distribution is heavily weighted to slow charging. Standard units at 3kW to less than 8kW made up 49% of chargers at 1 July 2026, and rapid units at 50kW to less than 150kW made up 12%1. In the July 2025 official data, devices rated 50kW to 149kW represented 10% of charging devices and the highest banding, 150kW and above, accounted for 11%7. Independent figures for July 2025 counted more than 46,000 UK charging devices with a power rating below 8kW, over 21,000 devices rated from eight to 49kW, 8,095 rapid devices and 8,842 ultra-rapid devices8.
Rapid and ultra-rapid chargers are a minority of units but a majority of capacity. They account for around 60% of the total capacity of the network, because each one delivers far more power than a standard unit3. That is the trade a driver makes: fewer sites, much faster charging.
Destination, on-street, en route and other: what each location type is for
The official location categories describe the journey, not the hardware. Destination charging devices are located at the end of a journey or where a driver may typically stop for an extended period: retail car parks, car parks, leisure and education areas and transport hubs, plus devices rated 49kW and below at hotels and restaurants7. En route charging devices are located for charging to continue a journey, at motorway service areas, service stations, electric forecourts and ferry terminals, plus 50kW and above devices at hotels and restaurants7. On-street charging devices are located on residential streets only7. Other charging devices are semi-public with some level of access restriction, such as workplace car parks and dealership forecourts7.
The shares tell a household what to expect. Destination chargers were 52% of the official total at 1 July 2026, on-street 33%, en route 11% and other 4%1. In the July 2025 data, 40,109 devices were designated destination, representing 49% of all charging devices, and 30,169 were designated on street, representing 37%7. Independent statistics for August 2026 count 63,630 destination chargers, 41,054 on-street chargers and 13,924 en-route chargers3.
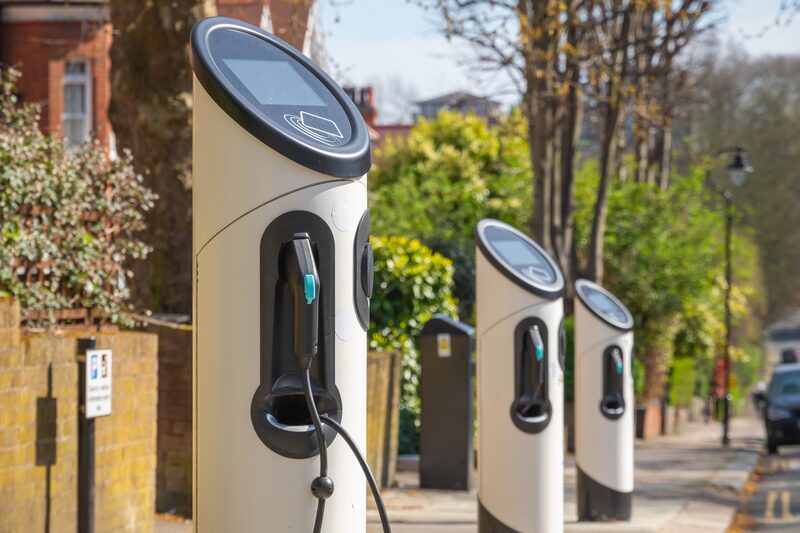
For a householder without off-street parking, the on-street category is the one that matters most, and it is the second largest. It is also the slowest to build, because it depends on local authority decisions about pavement, kerbside and power supply rather than on a single site owner. Destination charging covers the weekly shop and the leisure centre; en route covers the long journey. Neither substitutes for a charge point outside the front door.
Regional coverage: London, Scotland, Wales and Northern Ireland compared
Charger density varies by nation and region, and the differences are large enough to change what a household can plan for. As of 1 July 2026, London had 345.1 total EV chargers per 100,000 population and 27.9 rapid or above per 100,000; Scotland had 231.6 and 59.1; Wales had 185.5 and 42.8; Northern Ireland had 60.0 and 19.31. Within England, the North East had 150.2 and 37.1, and the North West had 112.1 and 40.01.
| Nation or region | Total chargers per 100,000 | Rapid or above per 100,000 |
|---|---|---|
| London | 345.11 | 27.91 |
| Scotland | 231.61 | 59.11 |
| Wales | 185.51 | 42.81 |
| North East | 150.21 | 37.11 |
| North West | 112.11 | 40.01 |
| Northern Ireland | 60.01 | 19.31 |
The pattern is not simply London ahead and everywhere else behind. London has the most chargers per head but a lower rapid density than Scotland, Wales or the North West, because its network is built around slow on-street and destination units for residents without driveways. Scotland has the highest rapid density of the four nations at 59.1 per 100,000, and its public charge point count per capita was 7% higher than the UK average as of May 20251. Northern Ireland is the clear outlier on both measures, at 60.0 total and 19.3 rapid per 100,0001.
The charger-to-car ratio shows the same unevenness from the other direction. Nationally there was one public charger for every 17 battery electric vehicles as of 1 April 2026, but in London there is one for every nine plug-in cars, against just one for every 40-plus plug-in cars in the South East and North West1. A high charger count in a region with few electric cars can still leave drivers waiting.
Scotland's charging landscape also differs in how it is funded. Two thirds of public EV charging in Scotland is already funded and delivered by the private sector, and the Scottish Government has set a target of 30,000 public charge points by 2030, up from around 6,00011. Scotland's public charge points were 10.3% of the UK total in a 2021 official consultation13.
What public charging costs per kWh, and how it compares with home charging
Public charging costs more than home charging, and the gap is wide. Energy Saving Trust states plainly that there are plenty of publicly available chargepoints across the UK, although these are more expensive than charging at home4. A published price comparison puts average standard and standard plus public charging at 54.00 pence per kWh and average rapid and ultra-rapid public charging at 79.00 pence per kWh, against a home price cap figure of 26.11 pence per kWh and home off-peak electricity at 3.59 pence per kWh5.
| Charging route | Price per kWh |
|---|---|
| Home off peak | 3.59p5 |
| Home price cap | 26.11p5 |
| Average standard or standard plus public | 54.00p5 |
| Average rapid or ultra-rapid public | 79.00p5 |
The same comparison models an 80% off-peak home and 20% rapid public split at 22.20 pence per kWh, and a home price cap driver covering 7,100 miles at £5165. Independent statistics for July 2025 put the average cost of charging an electric car on a public network at 52p per kWh on slow and fast charging devices, about 15p per mile, and recorded an average rapid charging cost of 76p in April 20258. The two sources disagree on the rapid figure, 76p against 79.00p, and the documents do not resolve it; both are given here as published.
Cost per charge is easier to picture than cost per kWh. Guidance for drivers compares a full 220 miles of charge at £17 for home charging, £37 for public fast charging, £53 for public rapid charging and £45 for a full tank of petrol4. The average cost to charge at home was £13 in October 2024, based on an average UK domestic electricity rate of 24.5p and a typical 54 kWh battery8.
The VAT position is the structural reason the gap exists. Electricity used at home is charged at the domestic rate, while electricity bought from a public chargepoint is a service and carries the standard rate. That difference is not a network's pricing decision and cannot be avoided by choosing a different operator. It is the single largest reason a household without a driveway pays more per mile than one with a home charge point, and it is why the same car can cost materially more to run depending on where it is plugged in.
Payment, access and how the networks work
Payment at a public chargepoint is not uniform. Networks variously accept contactless bank cards, smartphone apps, and RFID cards or fobs linked to an account, and some sites are free. The Scottish consultation on public charging lists affordable tariffs and ease of payment, including contactless, among the priorities drivers raise, alongside accessible infrastructure and surrounding environment, visibility of chargepoints, locations and availability, and reliable network and high uptime requirements12. Contactless is the route that needs no prior registration, which matters for a driver who rarely uses public charging.
The market is concentrated. Six networks make up 50% market share of rapid and ultra-rapid EV chargers3. That concentration is why roaming arrangements and payment cards exist: a driver who uses several networks can hold one account rather than several. It is also why the payment experience still varies by site, because each operator sets its own terms.
Free charging exists but is a small minority. As of 2025 there were around 1,600 chargepoints in the UK offering free charging14. These are typically hosted by a business absorbing the electricity cost, and they are not a dependable routine.
Charge points are found at public car parks, on-street, coffee shops, supermarkets, hotels, workplaces and service stations15. The government's EV charge point grant provides funding of up to 75% towards the cost of installing EV charge points, up to a maximum of £350, for rental accommodation or flat owners in the UK15. That grant supports home installation rather than public charging, and it is the main route by which a renter or flat owner can reduce reliance on the public network.
ChargeUK and the charging industry's role and investment
ChargeUK is the trade body for the charging industry, and its members operate around 70,000 charge points, or more than two thirds of the UK's public EV charging infrastructure16. Its members have committed to invest over £6 billion in private capital into EV charging by 203016. That concentration means the pace of network growth is largely set by a small number of commercial operators rather than by public bodies.
Public money runs alongside private investment. The October 2024 Budget confirmed funding of over £200 million in 2025 to 2026 to accelerate chargepoint rollout17. Public charging grant schemes have funded 24,945 EV charger installations since 2017 on provisional estimates18. There has been a £300m investment in the UK's public EV charging points19. The UK EV charging market is projected to reach a value of around £9.7 billion by 20338.
The scale of the task is set out in official analysis. The charging infrastructure for EVs needs to be deployed rapidly and at scale20. The Royal Town Planning Institute notes that increasing numbers of EVs will require locations of new charging points to be planned together with grid upgrades and the locations of other higher energy demand developments21. That is the constraint that a charger count alone does not show: a site needs a power connection before it needs a unit.
For a household, the industry structure matters in one practical way. The network a driver depends on is a commercial service, priced by its operator, and its coverage in a given street or town is a business decision. Energy independence from public charging is partial at best: the electricity is bought from a company, at a price that company sets, through equipment that company maintains.
How much infrastructure is needed as the EV fleet grows
Official analysis concludes that nearly 29,000 charging points are needed across Great Britain by 2030 to meet future EV charging needs22. That figure sits alongside a network that added 13,281 public EV chargers in 2025 and 5,119 in the first half of 20261. Growth has been steady: there were 82,002 public electric vehicle charging devices in the UK at 1 July 2025, 5,495 more than at 1 April 2025, an increase of 7%7. At the end of 2025 there were 116,052 charge points, an increase of 13% on the previous year19.
The historical trajectory shows how recent the build-out is. There were almost 25,000 public chargepoints in July 2021, over 30,000 charge-points in 11,000 locations in July 2020, and 59,590 public charging points as of 30 March 202423. Independent statistics recorded 19% more chargers added in 2024 than in 20233. By April 2025 there were 113 EV charging devices per 100,000 people in the UK8.
The demand side is the reason the target keeps moving. The UK commitment is to end sales of all new petrol and diesel cars and vans by 2030, with all new cars and vans zero emission at the tailpipe by 203526. As the fleet converts, the charger-to-car ratio has to hold or improve, and it currently varies from one charger per nine plug-in cars in London to one per 40-plus in the South East and North West10.
For a household, the planning point is that infrastructure arrives where the case is strongest commercially or politically. A driver in a well-served urban area will see the network improve; a driver in a rural area or a nation with low density may wait longer. The 16.7% of chargers in rural England and Wales against 17.5% of the population living there is close to parity, but parity in count is not parity in usefulness when journeys are longer1.
Product safety: the ROMADA charger recall and what it means for owners
Two product safety reports published in September 2026 concern ROMADA New Energy EV charging equipment, and both describe a serious risk of electric shock. The ROMADA New Energy EV Charger and Cable presents a serious risk of electric shock because it has poor quality internal connections, and internal wires which are all the same length, which could lead to the product losing protective earthing and becoming live during use27. The ROMADA New Energy Charging Pile (EV Charger) presents a serious risk of electric shock because it is possible for accessible metal parts to become live during use28.
Both were notified by Local Authority Trading Standards, and both products originate in China27. The charger and cable does not meet the requirements of the Electrical Equipment (Safety) Regulations 2016 or the Plugs & Sockets etc (Safety) Regulations 1994, and the import has been rejected at the border27. The notification numbers are 2609-0023 for the charger and cable and 2609-0021 for the charging pile27.
The relevance to public charging is indirect but real. Equipment sold cheaply through online marketplaces can reach a household without the conformity assessment that a reputable charge point carries, and a unit installed at home on that basis is a shock risk. For public charging specifically, the safety of a unit is the operator's responsibility, and a driver has no way to inspect it. The practical protection is to use established networks and to report a unit that shows damage, exposed conductors or a live-feeling metal case.
Where public charging falls short for householders without a driveway
The barriers are documented and consistent. In a government-commissioned survey of energy consumers unlikely to get an EV, 33% cited nowhere to charge near home29. In a 2020 survey of UK EV buyers, 44% cited lack of local charging points30. In 2025, 18% of non-EV buyers cited a lack of available public charging points as their main reason for not purchasing an EV8. The English Housing Survey found that households living in flats (11%) were more likely to have access to an EV charge point than houses or bungalows (6%), which reflects the concentration of charge points in urban areas rather than an advantage for flat dwellers31.
The government has recognised the gap. A £25 million scheme is intended to make it easier for residents without driveways to install home chargers26. That sits alongside the EV charge point grant for renters and flat owners, which provides up to 75% towards installation costs up to a maximum of £35015.
The structural limits remain. Public charging is more expensive than home charging, and the VAT treatment of public charging as a service rather than a domestic electricity supply is the reason4. The network is concentrated in urban areas, with 83.3% of chargers in England and Wales in urban locations1. Payment methods vary by network, and six networks hold 50% of rapid and ultra-rapid market share3. A household without a driveway is therefore dependent on a commercial service, priced by its operator, sited where the operator finds it worthwhile, and paid for at a rate that includes VAT a home charger would not attract.
That is the honest position on energy independence. A home charge point, particularly one paired with solar or a smart tariff, gives a household control over when and at what price it charges. Public charging gives convenience and coverage, but not control. For a driver who cannot charge at home, the network is the fuel supply, and the terms are set elsewhere.
Sources31 cited
- Public electric vehicle charging infrastructure statistics, 1 July 2026, GOV.UK, 2026
- EV charging statistics, Zapmap, 2026
- EV charging statistics, Zapmap, 2026
- Charging electric vehicles, Energy Saving Trust, 2026
- Reduced public charging prices could boost EV sales, ChargeUK, 2026
- Over nine in 10 rapid EV charge points built outside London in last two years, ChargeUK, 2026
- Electric vehicle public charging infrastructure statistics, July 2025, GOV.UK, 2025
- EV charging statistics, Uswitch, 2025
- Scotland's carbon budgets, Climate Change Committee, 2025
- EV mandate debate needs facts not anti-industry fiction, SMMT, 2026
- Scotland's Climate Change Plan 2026-2040, Scottish Government, 2025
- Electric vehicle public charging network implementation plan response, Energy Saving Trust, 2026
- Scottish building regulations: proposed changes to energy standards, Scottish Government, 2021
- Electric car charging guide, Carwow, 2025
- Electric vehicles for home: charging, Electricity North West, 2026
- ChargeUK responds to EU changes to automotive emissions targets, ChargeUK, 2025
- Accelerating to net zero: responding to the CCC progress report, GOV.UK, 2024
- Grant schemes for electric vehicle charging infrastructure statistics, 1 July 2026, GOV.UK, 2026
- Electric cars and energy bills, Uswitch, 2026
- Solar on car parks and electric vehicle charging, GOV.UK, 2025
- Electric vehicle charging infrastructure, Parliamentary Office of Science and Technology, 2025
- Plugging the gap: assessment of future demand for Britain's electric vehicle public charging network, Climate Change Committee
- Electric vehicle charging market study: final report, GOV.UK, 2021
- 2020 progress report to Parliament: your questions answered, Climate Change Committee, 2020
- Common misconceptions about electric cars, Zapmap, 2026
- Four more EV models qualify for £3,750 discount under Electric Car Grant, GOV.UK
- Product Safety Report: ROMADA New Energy EV Charger and Cable (2609-0023), GOV.UK, 2026
- Product Safety Report: ROMADA New Energy Charging Pile (EV Charger) (2609-0021), GOV.UK, 2026
- Consumer Survey 2021: decarbonisation and home energy use report, Ofgem, 2021
- Billions invested in electric vehicle range but nearly half of UK buyers still think 2035 too soon to switch, SMMT, 2020
- English Housing Survey 2023 to 2024: low carbon technologies in English homes fact sheet, GOV.UK, 2024
 Public EV Charging PricesCovers the published price series for public charging, how per-kWh rates differ by network and speed, and how they have moved over the past year.
 Charging Without a DrivewayParking on the street makes charging an electric car at home tricky.
 Home Charger InstallationWho can fit a home EV charger, and does it need building regulations approval?
 Charging and Energy IndependenceCharging an electric car at home can cut your fuel costs, but how much does it really free you from the grid?
 Charging With a Home BatteryHow a home battery and an EV charger share one supply, whether a battery can usefully charge a car, and how combined systems are controlled so the battery is not discharged into the vehicle at a loss.
 The Full EV Charging GuideCharging an electric car at home usually means a wallbox, but do you need one, and what will it cost to fit and run?