

In this comparison
Rural homes install renewable heating and power at a markedly higher rate than urban ones, and the gap is structural rather than a matter of preference. In Scotland, 57% of rural dwellings are not connected to the mains gas grid, against a much smaller share in towns, and 28% of rural dwellings use oil as their primary heating fuel compared with 1% of urban dwellings1. Off-grid households have the clearest financial case for switching, and the installation record reflects it.
The scale of the shift is visible in the certification data. Certified solar panel installations passed 203,125 in 2025, beating the previous annual record set in 2011, and the cumulative total reached 1.85 million certified solar installations2. Somerset and Cornwall led the way with 3,741 and 3,726 certified installations respectively for the year to that point2. Battery storage installations rose 122% year on year by the end of September 20252.
The pattern is not simply rural versus urban. It follows roof area, tenure, off-grid status and the presence of a supply chain. This page sets out what the published figures show, where installations cluster, what drives the difference, and what it means for a household's independence from the grid and from delivered fuels.
Rural and urban uptake at a glance
The headline figures for small-scale renewables are dominated by solar photovoltaics, and have been since the earliest years of support. In Scheme Year 13 of the Feed-in Tariffs scheme, solar PV accounted for 79.42% (5.15 GW) of installed capacity, and the scheme's own analysis described the dominance of solar PV installations, most of them domestic rooftop systems in the 0 to 4kW capacity range4. That concentration has not changed: in the 0 to 50 kW band, solar PV accounts for 99.3% of installations5.
The Smart Export Guarantee tells the same story from the export side. In Year 5 of the scheme, solar PV accounted for 99.98% of SEG installations (270,331) and 99.56% of installed capacity (1,578 MW)6. Where a household installs a generating technology, it is overwhelmingly a solar array, and the export payments that follow are solar export payments.
The rural skew is older than the current record years. In Scotland, 35,261 domestic installations were registered under the Feed-in Tariffs scheme by the time of a 2015 consultation3. The same consultation recorded that approximately 67% of applications to the Renewable Heat Incentive were for rural properties and 33% urban, a split that has proved durable3.
| Measure | Figure | Period | Source |
|---|---|---|---|
| Solar PV share of FIT installed capacity | 79.42% (5.15 GW) | Scheme Year 13 | 4 |
| Solar PV share of SEG installations | 99.98% (270,331) | SEG Year 5 | 6 |
| Solar PV share of installations, 0 to 50 kW band | 99.3% | Latest annual report | 5 |
| Rural share of Scottish RHI applications | approximately 67% | April to September 2014 | 3 |
What counts as a certified installation, and where the numbers come from
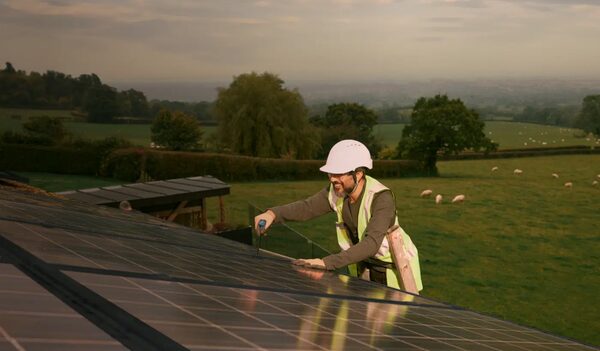
A certified installation is one carried out by a contractor holding certification under the Microgeneration Certification Scheme. MCS is a certification scheme for microgeneration installation companies and products, defining and maintaining consistent standards4. Certification is not decorative: for Feed-in Tariff applications, PV or wind installations with a declared net capacity up to and including 50kW, and micro CHP up to and including 2kW, must be installed by an MCS-certified installer to apply to a FIT licensee7.
The certification requirement runs through the support landscape. Installers on the Surrey County Council Warm Homes network are TrustMark Registered and MCS accredited for renewable technologies, and certified to PAS2035:20238. That combination of quality marks is now the standard expectation for publicly funded work, and it is what separates a certified installation from an unregistered one for the purposes of most published statistics.
The numbers themselves come from several places. Ofgem administers the Feed-in Tariffs scheme and publishes annual and quarterly reports on accredited installations4. The Smart Export Guarantee has its own annual report6. The Department for Energy Security and Net Zero publishes heat pump deployment statistics quarterly10. Local authority delivery schemes are reported through the Green Homes Grant Local Authority Delivery and Home Upgrade Grant statistical releases, which cover measures installed, homes upgraded, installation rates, installations by region, local authority and parliamentary constituency, carbon, bill and energy savings, and changes in Energy Performance Certificate ratings12.
Uptake by region: where installations cluster
Regional concentration is pronounced. Somerset and Cornwall recorded 3,741 and 3,726 certified installations respectively for the year to November 2025, the highest in the country2. Both are rural counties with substantial off-gas-grid housing, and both have an established installer base.
The Feed-in Tariffs quarterly data shows how dominant solar remains outside the leading regions: in all other regions solar accounts for over 74% of installed capacity9. The scheme's own annual report put solar PV at 99.28% of installations in the 0 to 50 kW band5, which is the band that covers domestic rooftops.
Scotland has its own pattern. Rural dwellings there are on average 32% larger than urban dwellings based on internal floor area, and only 40% of rural dwellings use mains gas heating12. Larger floor areas and a thinner gas network both push rural households towards renewable heating and towards the grant routes that support it.
Wales shows a similar rural reliance on delivered fuel. In rural areas of Wales, 28% of households rely on heating oil or liquid gas13. That figure sits behind much of the Welsh rural installation activity, because a household already buying oil has a direct comparison to make against a heat pump or a biomass system.
| Nation or region | Distinguishing feature | Figure | Source |
|---|---|---|---|
| England | Leading counties for certified installations | Somerset 3,741; Cornwall 3,726 | 2 |
| Scotland | Rural dwellings larger and less likely to have mains gas | 32% larger; 40% on mains gas | 12 |
| Wales | Rural reliance on delivered fuel | 28% of rural households on oil or liquid gas | 13 |
| All other FIT regions | Solar share of installed capacity | over 74% | 9 |
Why rural homes install more: the drivers behind the gap
Three factors explain most of the rural lead, and none of them is about environmental preference.
The first is the absence of a gas connection. In Scotland, 57% of rural dwellings are not connected to the mains gas grid1. A household with no gas supply is choosing between oil, liquid gas, electricity and a renewable system, and the renewable option competes directly on running cost rather than against a cheap mains gas tariff.
The second is physical capacity. Rural dwellings are on average 37% larger than urban dwellings based on internal floor area1. Larger roofs take more solar panels, and larger floor areas suit heat pumps and biomass boilers that need space for a cylinder or a hopper. The Scottish figures put the same gap at 32%12.
The third is the structure of support. The Energy Company Obligation carried sub-obligation targets to achieve a proportion of savings from households in rural areas and from households with harder to insulate solid wall construction14. That directed supplier effort towards rural properties, and the rural sub-obligation was met and exceeded by several suppliers: EDF Energy reached 207.6%, E (Gas & Electricity) 141.6%, Ecotricity 135.0% and Bulb Energy 103.8%, while Co-operative Energy reached 30.6%14.
The result is a rural household that faces a genuine choice between delivered fuel and a renewable system, with grant support weighted towards that choice, and with the roof and floor space to make it work. The dependence that remains is on the installer and on the electricity network for a heat pump, but the delivered-fuel dependence ends.
Why urban homes lag: constraints in towns and cities
Urban uptake is lower for reasons that are physical and legal rather than financial. The Heat in Buildings Bill consultation found that traditional buildings, flats and rural properties were frequently noted as being less suitable for both energy efficiency improvements and clean heating systems16. Flats and tenements present shared roofs, shared risers and freeholder or factor consent as obstacles that a detached rural house does not have.
The housing mix matters too. Around 60% of urban dwellings in Scotland are detached, terraced and semi-detached houses, accounting for 1.3 million of the 2.1 million urban dwellings1. That leaves a substantial minority in flats and other forms, where a rooftop solar installation is not a decision one household can take alone.
Supply chain capacity is a further constraint, and it is not confined to cities. The same consultation recorded concerns about a lack of skilled people to install and maintain clean heating systems, a lack of a developed supply chain, and the need for electricity infrastructure upgrades16. Where installer coverage is thin, waiting times lengthen and costs rise, which suppresses uptake independently of any property characteristic.
Urban areas also carry competing pressures on land and roof space. More rapid renewable energy deployment could cause localised, short-term damage to habitats through project development17, and the Committee on Climate Change has recommended an urban greenspace target to reverse the decline and ensure towns and cities are adapted to more frequent heatwaves18. Those are constraints on large-scale deployment rather than on domestic rooftops, but they shape the planning environment.
Grants and incentives: what changed for householders
The support landscape has shifted from technology-specific tariffs towards locally administered grant schemes. The Home Upgrade Grant provides energy efficiency upgrades and low carbon heating via local authority funding19. The Warm Homes: Local Grant funds insulation, energy-efficient heating systems and renewable energy installations20. Both route money through councils rather than through suppliers or direct applications.
The older schemes left a data trail that still shapes the picture. The Domestic Renewable Heat Incentive paid accredited installations over seven years, and its rules interact with grant funding: installations fully funded by a public funds grant are not eligible, and partial grants are deducted from payments spread evenly over the seven years of accreditation21. A household that took grant money for part of a heat pump cost therefore saw its RHI payments reduced accordingly.
The Domestic RHI has now closed to new applications, and the quarterly deployment statistics show the tail: 2025 Q1 recorded 0 new domestic RHI installations10. For comparison, 2021 Q3 recorded 3,722 installations in a single quarter11. The scheme's final annual report noted that 17.7% of installations replaced storage heaters22.
The Feed-in Tariffs scheme has also closed to new applicants, but its rules still matter for households with legacy accreditation. For accredited FIT installations of 30 kilowatts or less using solar photovoltaic, the deemed export is 50% of the generation meter reading where electricity is not measured by an export meter23. That deeming rule is why older solar households receive export payments without an export meter.
| Scheme | Status | What it covers | Source |
|---|---|---|---|
| Home Upgrade Grant | Local authority funding | Energy efficiency upgrades and low carbon heating | 19 |
| Warm Homes: Local Grant | Local authority funding | Insulation, efficient heating, renewables | 20 |
| Domestic RHI | Closed to new applicants | Renewable heat, paid over 7 years | 21 |
| Feed-in Tariffs | Closed to new applicants | Generation and deemed export | 23 |
What the rural-urban gap means for household energy independence
The gap matters because it maps onto different kinds of dependence. A rural household that installs a heat pump and solar ends its reliance on delivered oil or liquid gas, and reduces its exposure to a fuel it must buy in advance and store on site. The Carmarthenshire guidance states the benefit plainly: renewable technologies reduce reliance on fossil fuels such as gas and oil and therefore reduce fuel bills and carbon emissions24.
What remains is dependence on the electricity network and on a supplier. A heat pump runs on electricity, and a solar array without storage exports at times of surplus and imports at times of need. The National Energy Efficiency Data Framework records annual electricity consumption in the range of 100 to 25,000 kWh across the housing stock25, a spread wide enough that a rural off-grid home and an urban flat are barely comparable in their consumption profile.
The urban picture is different. Urban dwellings use electricity as their primary heating fuel in 8% of cases and oil in 1%1. Most urban homes are on mains gas, which is cheap relative to delivered fuel but leaves the household exposed to wholesale gas prices and to the standing charges that come with a connection. Installing solar in a flat is often not within one household's gift, so the independence gain is unavailable rather than merely unattractive.
The certification and consumer protection framework applies equally in both settings. The Renewable Energy Consumer Code sets out the standards applicable to the selling or leasing of small-scale heat and power generators, whether from renewable or other low carbon sources, to domestic consumers26. That protection matters more, not less, where a household is making a first purchase of an unfamiliar technology.
How to read the local data for your own area
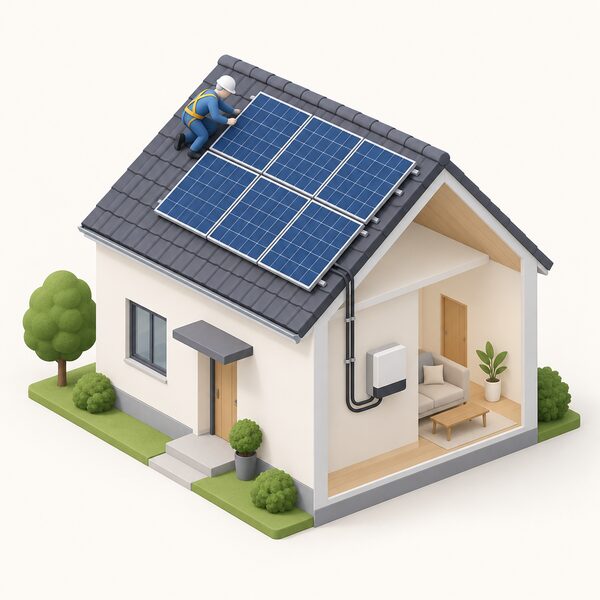
Local authority level data is published and usable. The Green Homes Grant Local Authority Delivery and Home Upgrade Grant releases break down measures installed, homes upgraded, installation rates, installations by region, local authority and parliamentary constituency, carbon, bill and energy savings, and changes in Energy Performance Certificate ratings12. That is the most granular official view of publicly funded installation activity.
For certified installations specifically, the MCS data is the reference point. The 2025 record of 203,125 certified solar installations, against a previous record set in 2011, and the 1.85 million cumulative total, are drawn from MCS certification records2. Certified battery storage installations had increased by 122% compared to the equivalent period a year earlier by the end of September 20252. In June 2025, the record for the highest volume of certified solar going onto new builds in a single month was set at 9,507 installations2.
Two cautions apply when reading any of this. First, the local authority releases run two months in arrears, so the latest month is provisional12. Second, certification data counts installations, not households, and a household that installs solar and a battery appears twice.
For a household weighing its own area, the useful comparison is between the local installation rate and the local housing mix. A rural district with a high off-gas-grid share and a high installation rate is showing that the practical barriers have been solved locally. An urban district with a low rate may be showing a housing stock problem rather than a lack of interest.
Sources26 cited
- Scottish House Condition Survey 2024: key findings, Scottish Government, 2024
- UK rooftop solar installations hit record high, MCS Certified, 2025-11-13
- Permitted development rights for non-domestic solar panels and domestic air source heat pumps, Scottish Government, 2015-06
- Feed-in Tariffs Annual Report Scheme Year 13, Ofgem, 2023-12
- FIT annual report Scheme Year 14, Ofgem, 2024-12
- Smart Export Guarantee Annual Report Year 5, Ofgem, 2025-12
- Feed-in Tariffs factsheet, Ofgem, 2017-04
- Warm Homes Local Grant, Surrey County Council, 2026-09-17
- Feed-in Tariffs quarterly report issue 63, Ofgem, 2026-03-30
- Heat pump deployment quarterly statistics, UK 2025 Q1, Department for Energy Security and Net Zero, 2025
- Heat pump deployment quarterly statistics, UK 2025 Q3, Department for Energy Security and Net Zero, 2025
- Scottish House Condition Survey 2023: key findings, Scottish Government, 2023
- Welsh Government fuel voucher scheme, Welsh Government, 2022-06-10
- ECO3 Final Determination Report, Ofgem, 2023-02
- Energy Company Obligation ECO3 final determination report, Ofgem, 2023-02-09
- Delivering net zero for Scotland's buildings: Heat in Buildings Bill consultation analysis, Scottish Government, 2026-01-29
- Preparing Wales for a renewable energy 2050, Welsh Government, 2023-10
- Risks to health, wellbeing and productivity from overheating in buildings, Climate Change Committee, 2026-09-19
- Home Upgrade Grant: Phase 2, Department for Energy Security and Net Zero, 2022-09-29
- Home and business grants, schemes and advice, East Hertfordshire District Council, 2026-09-17
- Domestic Renewable Heat Incentive: applicants, Ofgem, 2026
- Domestic RHI 2023-24 Annual Report, Ofgem, 2024-07
- Feed-in Tariffs determinations, Year 16, Department for Energy Security and Net Zero, 2026-02-26
- Renewable energy, Carmarthenshire County Council, 2025-07-01
- National Energy Efficiency Data Framework need report, Department for Energy Security and Net Zero, 2026
- Renewable Energy Consumer Code, Chartered Trading Standards Institute, 2026-09-20
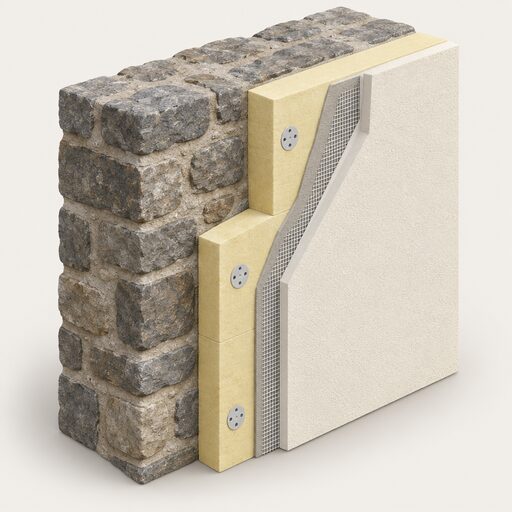 Energy in Rural HomesHeating a rural home costs more because there is often no gas supply, so you rely on oil or electricity instead.
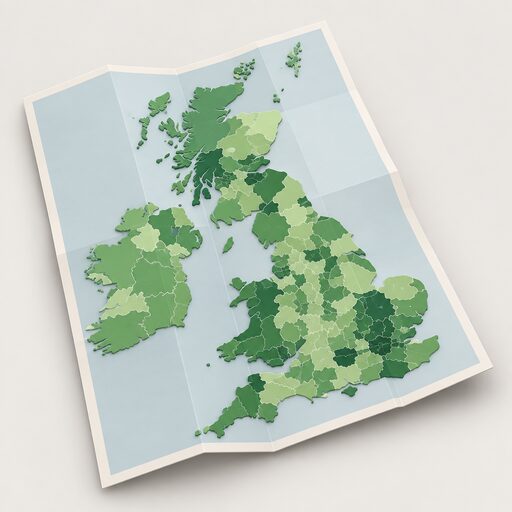 MCS Data by Local AuthorityHow many solar panels, heat pumps or batteries have gone into homes in your council area?
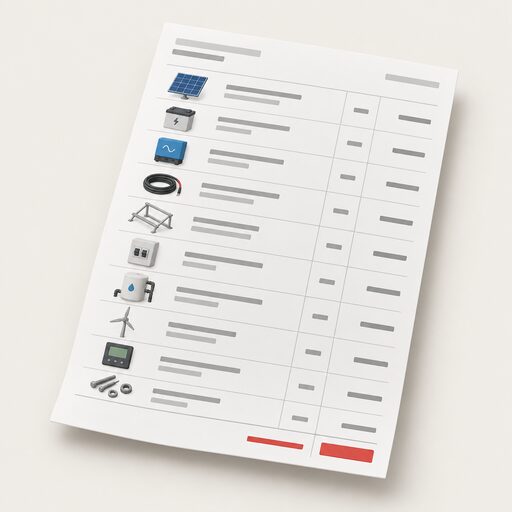 Off-Grid System CostWhat does going off grid really cost, and what makes up most of that figure?
 Microgeneration UptakeScotland has more solar panels and heat pumps per household than England, while Wales has built larger solar schemes and Northern Ireland lags behind.
 Energy IndependenceA heat pump runs your heating on electricity instead of gas or oil, so how much does that really cut what you pay and how exposed you are when fuel prices jump?
 Installation Cost TrendsTracks the published median and average installed costs of domestic solar, heat pumps and batteries and how they have moved.