

In this answer
Short answer
A postcode wind speed check is a screening step, not a site survey. The Energy Saving Trust's energy tools and calculators include a wind speed predictor that takes a postcode and returns an estimated speed for that location1. The figure it returns comes from the NOABL database of estimated wind speeds at heights of 10 metres or more, modelled for flat terrain and averaged over a kilometre square2.
That single number is the beginning of a decision, not the end of one. The Energy Saving Trust advises considering a wind turbine only where the local annual average wind speed is five metres per second or more, and where there are no major obstacles nearby such as buildings, trees or hills likely to reduce wind speed or increase turbulence3. A typical domestic system for a home would be 2.5 to six kilowatts, depending on the location and size of the house3.
The gap between a postcode estimate and a real site is the whole story of domestic wind. Two houses on the same street can sit in different wind regimes, and the modelled average cannot see either of them. What follows sets out what the predictor gives you, how to read it, and where it stops being useful.
Wind speed at your postcode: what the predictor gives you
The predictor is a lookup. You supply a postcode, and the tool returns an estimated mean wind speed for that grid square. The Energy Saving Trust hosts it within its energy tools and calculators1. The data underneath is the NOABL database of estimated wind speeds at heights of 10 metres or more, modelled for flat terrain and averaged over a kilometre square2.
Two things follow from that description. First, the figure is a model output, not a measurement. Nobody put an anemometer in your garden. Second, the model assumes flat ground, so any hill, wood, housing estate or shelter belt within the square is invisible to it. The result is best understood as the wind resource of the open landscape your postcode sits in, before anything is built on it.
The same modelling approach now appears in certification. MCS 033 V1.0 describes a first prediction method that uses the proposed location to look up the mean wind speed using the Global Wind Atlas6. That is a different dataset from NOABL, but the principle is identical: a location is used to look up a modelled mean, rather than to measure the site.
For a household, the predictor works as a first filter rather than a verdict. A postcode returning a mean wind speed well below five metres per second indicates a site where a turbine is unlikely to generate enough to repay its cost; a figure comfortably above that marks a site worth measuring properly before any spend is committed. The prediction itself is modelled, drawn from a look-up of mean wind speed in the Global Wind Atlas2, not a measurement of the ground your mast would stand on. Trees, buildings and local terrain are invisible to it. It narrows the field; it settles nothing.
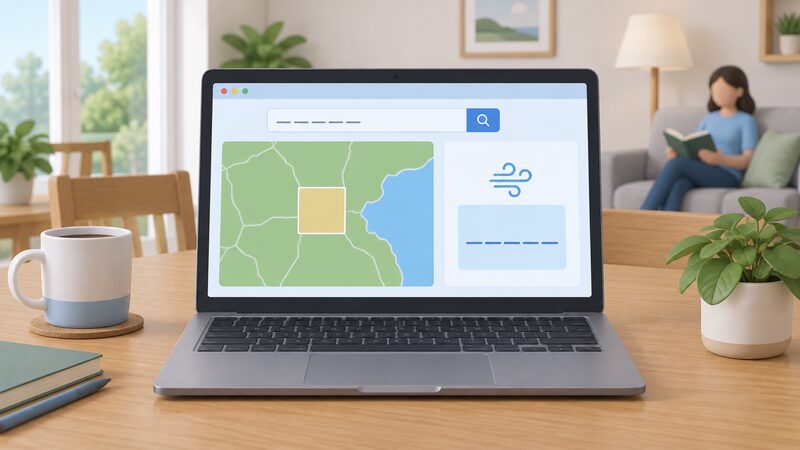
How to enter your postcode and read the results

The mechanics are simple. The Energy Saving Trust tool asks you to enter your postcode and returns an estimated wind speed for that location1. There is no account, no fee and no site visit. The output is a single speed, and the judgement is entirely yours.
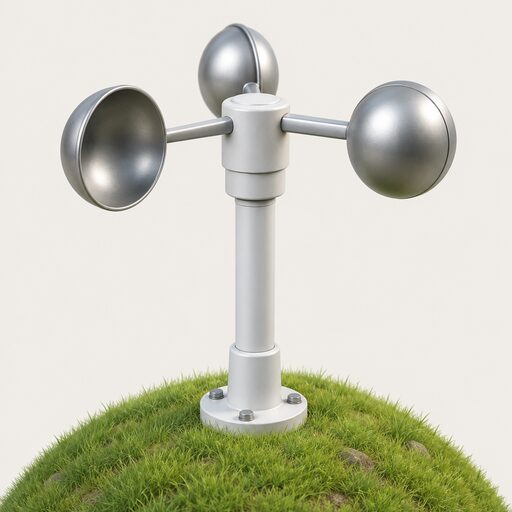
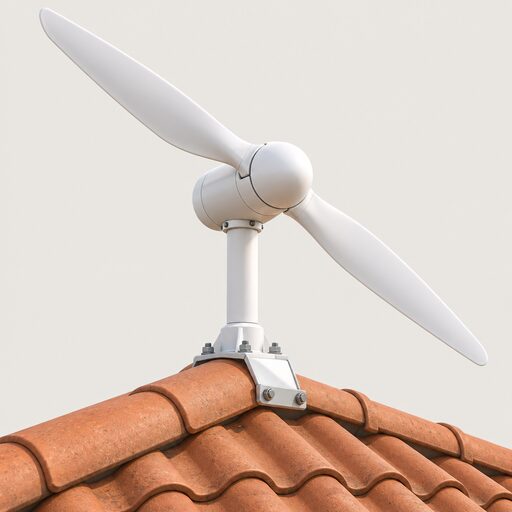
Reading it well means knowing which number you are looking at. The NOABL data sits at heights of 10 metres or more2. A pole-mounted turbine may reach that height; a roof-mounted one generally will not, and wind speed falls as you come down towards roof level. A figure quoted for 10 metres therefore describes a resource your roof may never see.
Units matter too. The five metres per second threshold is quoted in metres per second3, while forecasts and consumer sources often use miles per hour. The two cannot be compared directly, so convert before drawing any conclusion. A gust figure from a weather warning is not a site average either: gusts of 55 to 60mph inland and up to 70mph in coastal areas were forecast for central southern England in March 20247, and those are short-lived peaks, not the annual mean a turbine is judged on.
If the postcode result is promising, the sensible next step is a proper site assessment. The Energy Saving Trust's field trial of small-scale wind, Location, Location, Location, examined how much real-world performance diverged from expectations8. That divergence is the reason a postcode lookup should be treated as the first filter rather than the last word.
What the wind speed figure means for a home turbine
Wind speed is the single strongest determinant of output, and the relationship is steep. Doubling the wind speed will yield eight times as much power4. That cubic relationship explains why a site at six metres per second is not marginally better than one at five, but substantially better, and why a site at four is not marginally worse but dramatically so.
The threshold guidance is consistent across sources. The Energy Saving Trust advises considering a turbine only where the local annual average wind speed is five metres per second or more3. Consumer guidance repeats that the Energy Saving Trust recommends installing only in areas with at least 5m/s of wind or more9. The Centre for Alternative Technology states that you generally need an average of more than 5m/s2. Electricity North West puts the optimum at around five metres per second10.
Output scales with rotor size as well as speed. A turbine with a rotor diameter of about 1 metre, on a site with good average wind speeds, could give a few hundred kilowatt-hours of electricity per year4. Individual wind turbines vary in size and power output from a few hundred watts to two or three megawatts, where one megawatt equals 1,000 kilowatts3. Larger units used to power homes and businesses generate between 0.6 and 50kW9.
For a household, the figure decides whether a turbine is a generating asset or a decorative one. At or above five metres per second, a well-sited machine can contribute meaningfully to a home's electricity. Below it, the same machine will spend most of its time below its cut-in speed, and the household remains dependent on the grid for effectively all of its power.
Why wind speed varies within one postcode
A postcode is an administrative unit, not a meteorological one. It can cover a hilltop and a sheltered valley, a coastal strip and an inland hollow. The modelled average smooths all of that into one number, and the smoothing is the source of most of the error a household will encounter.
Real weather data shows how sharply wind varies over short distances. In December 2025, gusts were forecast to be strongest in the Western Isles, the West Highlands and on Skye, where 90 mph winds were possible11. In November 2025, gusts of up to 75mph were forecast to move in from the west of Scotland from late afternoon, affecting Argyll, the Western Isles, the north-west Highlands and Caithness12. Those are regional patterns, but they illustrate the point: exposure to the west and to the coast dominates.
Forecast error compounds the problem. During Storm Henk in January 2024, gusts across central southern England came in some 10-15mph higher than originally forecast13. A model that cannot see your garden is also a model that cannot see the difference between a forecast and the outcome.
The same principle applies to grid costs, which vary by region for reasons of transport distance14. Wind resource varies for reasons of topography and exposure. In both cases, a national or postcode-level average conceals the local reality that determines the household's outcome.
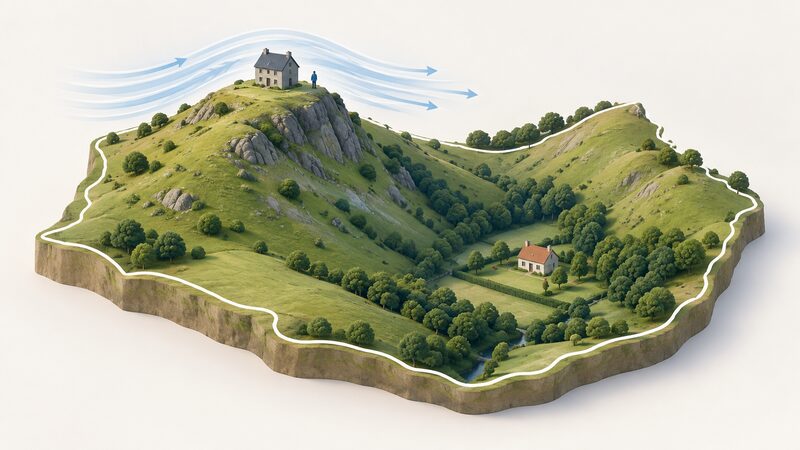
Limits of postcode-level wind estimates
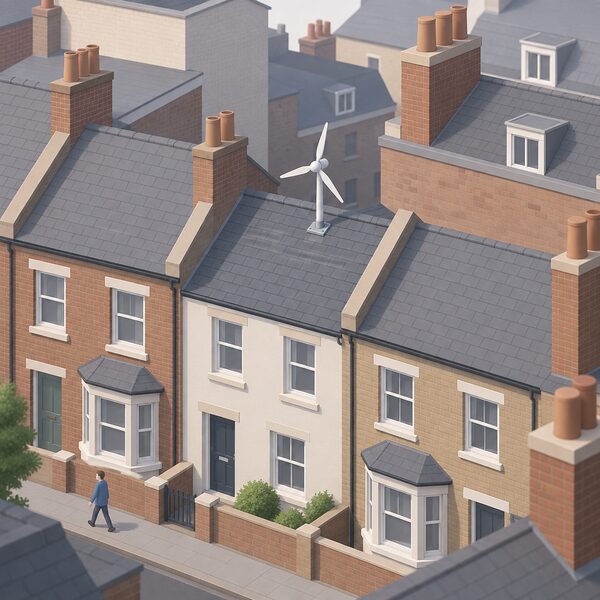
The predictor's limits are structural, not incidental. It models flat terrain, averages over a kilometre square, and reports a height of 10 metres or more2. Buildings, trees and hills are absent from the model. The Energy Saving Trust's own condition for considering a turbine is that there are no major obstacles nearby likely to reduce wind speed or increase turbulence3. Where obstacles exist, the estimate is optimistic.
Building-mounted turbines illustrate the failure mode. Studies show them to be far less effective owing to lower wind speeds9. The Energy Saving Trust notes that systems work best in exposed, windy locations and are less suitable for built-up or sheltered areas15. A postcode estimate for a dense urban square may return a figure that no roof in that square can actually reach.
Certification recognises the measurement problem. MCS 012 requires that the wind speed be measured to a maximum inaccuracy of 0.5 m/s5. That is the standard for a real measurement, and it is a useful yardstick for judging a modelled one: a database averaged over a kilometre square cannot meet it.
Site type, exposure and what the rules allow
The question that matters is whether the site suits a turbine at all, and the answer turns on exposure rather than on the house's heating system.
The Energy Saving Trust puts it plainly: if your house is in an exposed or isolated spot, it could bring you great benefits16. The same guidance notes that systems work best in exposed, windy locations and are less suitable for built-up or sheltered areas15. The distinction is between a site with clean airflow and one with turbulence.
Site type also shapes what is permissible. Under permitted development for domestic wind turbines in England, any part of the turbine including blades positioned within 5 metres of any boundary of the curtilage means development is not permitted17. Scottish Government consultation material describes domestic micro-scale wind turbines under 50kW as being over 100m from the nearest property boundary18. Those distances are about neighbours and safety, but they also push machines towards more open ground, which tends to help the wind resource.
Building regulations capture only part of the work. If the wind turbine is not attached to your house, then only the electrical installation and connection will be captured by the requirements of the building regulations19. A roof-mounted machine brings the structure itself into scope.
For households weighing options, the wider picture is set out in domestic wind turbines and in the siting guidance at wind speed and siting for a home wind turbine. The microgeneration pillar covers how wind sits alongside hydro, micro-CHP and fuel cells.
What the wind speed figure means for energy independence

A postcode wind speed check is the first honest test of whether a home can generate its own electricity from wind. If the modelled average clears five metres per second and the site is genuinely exposed, a turbine can offset a meaningful share of a household's demand and reduce what it draws from the grid3. That is real independence, and it is measured in kilowatt-hours rather than in sentiment.
The dependence that remains is substantial. A grid-connected turbine still relies on the network for the hours when the wind does not blow, and on a supplier for the shortfall. The wind itself is variable: gusts of 90mph were forecast for the most exposed areas of the north of Scotland in August 202520, and Storm Floris brought the prospect of 90mph gusts in exposed areas21. A machine must survive those peaks to deliver anything in the calm weeks between them.
There is also a data dependence. The postcode figure comes from a national database, and the certification route now looks up the mean wind speed using the Global Wind Atlas6. Neither is the household's own measurement. Independence in generation does not remove dependence on someone else's model to decide whether generation is worth attempting.
The Feed-in Tariff, which once paid for small wind generation, is closed. The tariff table for non-PV technologies set rates by capacity band, with wind above 100kW but not exceeding 500kW at 20.60 pence per kilowatt-hour for the 1 April 2010 to 30 November 2012 period22. Those rates are historical. Any household considering wind today is looking at self-consumption and export arrangements rather than a legacy tariff.
Sources22 cited
- Energy tools and calculators, Energy Saving Trust
- Domestic wind power, Centre for Alternative Technology, 2023-10-01
- Wind, nidirect
- Wind power, Centre for Alternative Technology, 2025-06-27
- MCS 012 Product Certification Scheme Requirements, MCS, 2013-06-21
- MCS publishes updates to small wind turbine standards, MCS, 2024-12-06
- Weather warning central southern England Monday 13 March, SSEN Distribution, 2023-03-13
- Location, Location, Location field trial small-scale wind report, Energy Saving Trust, 2009-07
- Wind turbines, Uswitch, 2026-01-06
- Wind power, Electricity North West, 2026-09-19
- As Storm Bram moves in we've further scaled up our response, SSEN Distribution, 2025-12-09
- Weather warning in the north of Scotland ahead of high winds, SSEN Distribution, 2025-11-27
- Weather warning central southern England Thursday 28 March, SSEN Distribution, 2024-03-28
- Default tariff cap policy consultation overview, Ofgem, 2018-05-25
- Wind turbines, Energy Saving Trust
- Could you generate your own energy, Energy Saving Trust, 2024-04-12
- Class H installation or alteration etc of wind turbine on domestic premises, legislation.gov.uk, 2026-09-17
- Scottish Government's programme extending permitted development rights, Scottish Government, 2019-06
- Wind turbines building regulations, Planning Portal, 2026
- We've moved to Yellow Alert ahead of Storm Floris, SSEN Distribution, 2025-08-03
- SSEN Distribution moves to Yellow Alert status for the North of Scotland, SSEN Distribution, 2023-01-30
- Feed-in Tariff table 1 December 2012 non-PV, Ofgem, 2012
 Turbine Siting and Wind SpeedIs my garden windy enough for a home wind turbine?
 Wind Turbine Output and SizingHow much electricity a home wind turbine makes depends far more on your wind than on its size.
 Domestic Wind TurbinesCan a wind turbine really power a home, and is your site windy enough?
 Wind Turbine InstallationWill a wind turbine actually pay for itself in a normal British garden, and how much wind does your spot really need?
 Building-Mounted Wind TurbinesWill a wind turbine on your roof actually make enough electricity to be worth it?
 Measured vs Modelled PerformanceWhy does a home use more energy than its rating predicts, and what does that mean for your bills?